Role of India VIX in Forecasting Market Fluctuations
India VIX is a crucial metric that measures expected market volatility based on NIFTY options prices, serving as a sentiment indicator for traders. It typically moves inversely with NIFTY, rising during uncertainty and falling in stable conditions, impacting option pricing and market sentiment. By tracking India VIX, traders can better anticipate market fluctuations, adjust their risk management strategies, and navigate volatility-driven events effectively.
Market volatility is an inherent part of investing, and traders often seek indicators to gauge uncertainty and risk. One such key metric is India VIX, of the Indian stock market. India VIX measures the expected market volatility over the next 30 days, based on the demand and supply of NIFTY options prices. Think of it as a thermometer for market sentiment. A high India VIX signals that market participants anticipate significant price fluctuations, whereas a low VIX suggests stability.
Understanding the Volatility Index (VIX)
The CBOE Volatility Index (VIX), also known as the "fear index," was developed by the Chicago Board Options Exchange (CBOE) to measure market expectations of volatility in S&P 500 Index options. Created through the financial research of Menachem Brenner and Dan Galai in the late 1980s, the VIX reflects investor sentiment and the expected degree of price fluctuations over the next 30 days.
The index is constructed using a weighted average of implied volatility from various S&P 500 options. This provides insights into expected price movements and potential market trends.
Volatility Index ETFs
A Volatility Index ETF tracks an index that reflects the performance of volatility indices such as India VIX or global counterparts like the CBOE VIX. These ETFs allow investors to gain exposure to market volatility without directly trading derivatives.
What Does India VIX Tell Us?
India VIX primarily indicates the level of uncertainty in the market. A high India VIX suggests that investors expect increased price volatility, particularly in high-beta stocks. Conversely, a low VIX signals a more stable market environment.
The India VIX fluctuates depending on market conditions. Under normal circumstances, it typically ranges between 11 and 17. However, if it moves below 11 or above 17, it may indicate significant market developments, warranting caution from traders.
India VIX and NIFTY generally share an inverse relationship—when VIX rises, NIFTY tends to fall, and vice versa. This occurs because increased uncertainty drives demand for protective PUT options, raising VIX and putting selling pressure on stocks, which pushes NIFTY lower. Conversely, in stable or rising markets, lower demand for options reduces VIX, signaling confidence and often driving NIFTY higher. However, this relationship isn't always absolute; VIX can rise due to anticipated events or decline post-market recovery, even when NIFTY remains in a consolidation phase.
India VIX in the Context of Option Pricing
India VIX plays a crucial role in option pricing by reflecting market expectations of future volatility. For option traders, understanding India VIX is essential, as it helps gauge potential price swings.
- A higher India VIX suggests larger expected price movements, leading to increased option premiums.
- A lower India VIX indicates reduced expected volatility, resulting in lower option premiums.
These insights are valuable for both buyers and sellers in strategizing their trades. Additionally, shifts in India VIX can signal changes in market sentiment, helping traders assess potential risks and adjust their strategies accordingly.
How India VIX Is Calculated?
India VIX forecasts volatility in the Indian markets for the next 30 days, deriving its value from the NIFTY options order book. Its calculation follows the CBOE VIX methodology with modifications to fit the Indian NIFTY options market.
Key components of the India VIX calculation include:
-
Time to Expiration (T): The remaining minutes until option expiry, expressed as a fraction of a year.
-
Risk-Free Rate (R): A short-term rate, such as NSE MIBOR.
-
Forward Index Level (F): Derived from NIFTY futures prices of the same expiry.
-
Strike Prices (K_i): The option strike prices considered in the calculation.
-
Option Price (Q(K_i)): The midpoint (average) of the bid and ask prices for each option.
-
K0: The strike price immediately below the forward level, treated as the at-the-money strike.
-
Intervals (ΔK_i): The difference between consecutive strike prices, used in summations.
Calculation Components:
- Time to Expiration (T): How many minutes remain until the options expire, expressed as a fraction of a year.
- Risk-Free Rate ®: A short-term rate (e.g., NSE MIBOR).
- Forward Index Level (F): Taken from the NIFTY futures price of the same expiry.
- Strike Prices (K_i): The option strikes considered.
- Option Price (Q(K_i)): The midpoint (average) of the bid and ask for each option.
- K0: The strike price immediately below the forward level (treated as the at-the-money strike).
- Intervals (ΔK_i): The difference between one strike price and the next, used in summations.
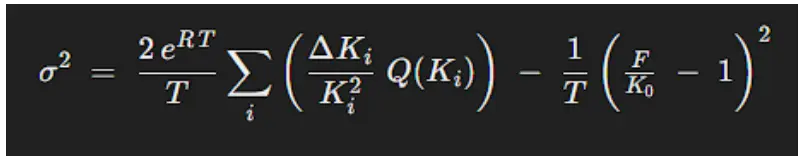
2. The Formula
A simplified version of the formula for the implied volatility ((\sigma)) is:
Yes, this works well as a concise and structured explanation of the calculation components. However, if you want a smoother flow, consider this slight refinement:
The India VIX calculation incorporates several key variables:
- (T) = Time to expiration (expressed in years).
- (R) = Risk-free interest rate.
- (F) = Forward index level (derived from NIFTY futures).
- (K₀) = The first strike price below the forward index.
- (ΔKᵢ) = The interval between strike prices.
- (Q(Kᵢ)) = The midpoint of the bid-ask quote for the i-th option.
- (e) = Euler’s number, accounting for continuous compounding.
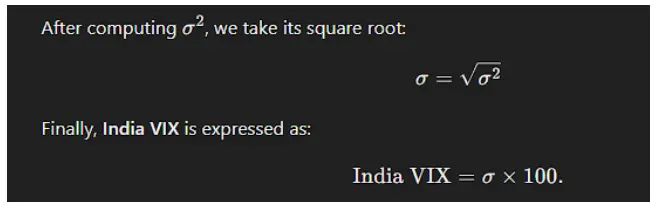
After computing σ² (variance), we take its square root to derive σ (volatility).
How the Pieces Fit Together
1. Gather Option Data
- Identify out-of-the-money (OTM) calls (strikes above F) and OTM puts (strikes below F).
2. Calculate Time to Expiration (T)
- Count the exact minutes remaining until option expiration.
- Divide by the total number of minutes in a year (525,600) to express it as a fraction of a year.
3. Find the Risk-Free Rate (R)
- Use a short-term market rate, such as the 30-day or 90-day NSE MIBOR.
4. Determine the Forward Index (F)
- Take the latest traded price of NIFTY futures that matches the option’s expiry.
5. Locate K₀ (At-the-Money Strike)
- Identify the strike price just below (F)—this serves as the at-the-money (ATM) reference.
6. Compute Sums in the Formula
- For each selected strike (Kᵢ):
- Calculate the strike price interval (ΔKᵢ).
- Find the midpoint price (Q(Kᵢ)) from bid-ask quotes.
- Plug values into the summation formula.
7. Compute India VIX
- Apply the VIX formula to derive σ (volatility).
- Multiply by 100 to express it in percentage terms.
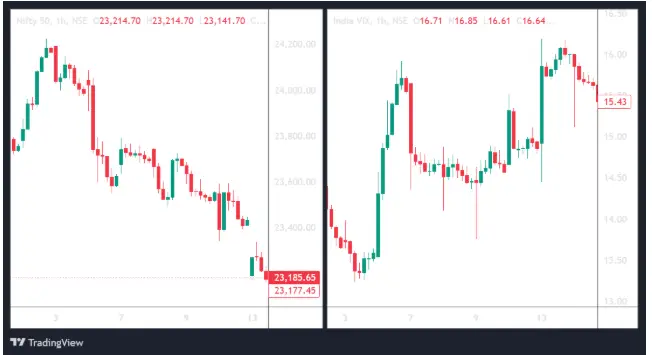
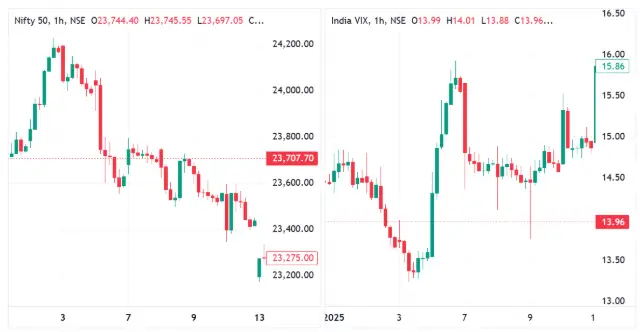
NIFTY 50 and VIX Chart Representation
The chart visually demonstrates the inverse relationship between the NIFTY 50 index and India VIX. When VIX rises, NIFTY typically declines, reflecting heightened market uncertainty. Conversely, a falling VIX often signals confidence, supporting an uptrend in NIFTY.
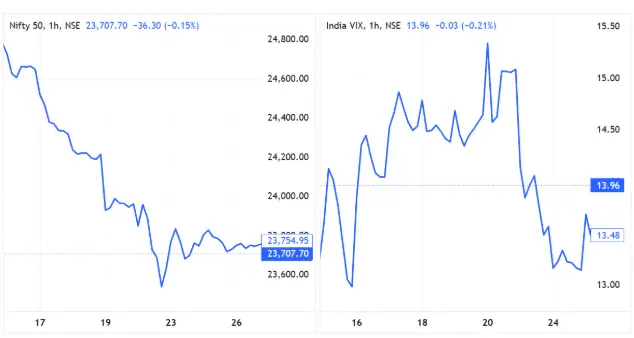
VIX correlation with Nifty
On major event days like the Union Budget or RBI policy announcements, the India VIX doesn’t always move in sync with the Nifty 50. While VIX typically rises when markets fall and drops when markets rally, this pattern can break during high-impact events.
For example, on Budget Day, the market might surge if the announcements are favorable, but the VIX could still remain high or even rise because traders anticipate sharp swings in either direction as more details unfold. Similarly, during RBI policy decisions, even if the Nifty 50 remains stable or moves up, the VIX may stay elevated due to uncertainty around future rate moves and their impact on different sectors.
The VIX represents the volatility observed in the Nifty. In such scenarios, it is advisable to avoid intraday trading, as the likelihood of stop-losses being triggered increases. The huge spikes on the VIX chart indicate heightened volatility, as shown below.
Volatility on VIX impact on Nifty
Major Drivers for Movement in India VIX
There are several variables inducing movement in India VIX:
Market Sentiment: Volatility expectation is widely driven by investors' emotions and reactions to news.
Economic Indicators: The releases of economic data (like GDP growth or inflation rates) will impact the overall perception of the stability of the markets.
Global Events: International developments cause anguish in the financial markets, from geopolitical tension to global financial crises.
Activity in the Options Market: The demand and supply dynamic in the options market is highly instrumental in determining the levels of implied volatility.
Conclusion
India VIX serves as a key indicator of market volatility, and platforms like Tradejini provide traders with the tools to analyze VIX movements and make informed decisions. While it does not provide direct buy or sell signals, understanding VIX movements allows traders to adopt a more cautious approach, especially during periods of heightened volatility. By monitoring India VIX, market participants can better assess risk and adjust their strategies accordingly, ensuring they are well-prepared for potential market fluctuations.
Written by Suchitra
Sat Feb 08 2025 / 2 Min Read
Featured Posts

By Asma Torgal
8th July 2024
Stock Market Sentiment Drives Trading Decisions

By Tejaswi P
30th Aug 2024
Can Government Employees Do Trading in the Stock Market?
_11zon.webp?alt=media&token=bd974821-aee4-43a5-b467-01d1a67a570b)
By Suchitra
29th Mar 2025
Algo Trading in India Tech-Driven Strategies for Modern Investors
_20_11zon.webp?alt=media&token=6659b2e6-927e-42de-8375-e227e579f556)
By Asma Torgal
28th Mar 2025
Trading Across Time Zones, The Global Market Timings in IST
By
Fri Mar 21 2025
How to Use Parallel Channels, Trends & Patterns
_11zon.webp?alt=media&token=a8f3f55c-dc70-4d42-844e-6874ceff69ce)
By Suchitra
20th Mar 2025
Swing and Positional Trading with Pivot Points
_11zon.webp?alt=media&token=a05d2324-cace-44ed-a35f-50f9e63be9c3)
By Suchitra
13th Mar 2025
How Central Banks Influence Indian Stock Market Trends
_11zon.webp?alt=media&token=14cd8f87-8add-49ce-84f1-ca07a0c52b0c)
By Suchitra
12th Mar 2025
Two Essential Candlestick Patterns for Market Timing

By Suchitra
05th Mar 2025
How Algorithmic trading revolutionizes modern markets with efficiency and speed
By Asma Torgal
24th Sep 2024
Lot Size in Futures & Options Trading