How Market Breadth Indicators Help Traders Assess Trends?
Market breadth indicators, such as the Advance/Decline Ratio and the Advance-Decline Line, offer insights into the overall health of the market, revealing whether a rally or decline is supported by a broad base of stocks. By analyzing these indicators, investors can spot trends, divergences, and weaknesses, helping them make more informed decisions and manage risk.
How Market Breadth Indicators Help Traders Assess Trends
Imagine that you are at a party. Some people are dancing, some are chatting, and some are eating their food. If only a few people are on the dance floor, would you be inclined to call it a lively party? Probably not so much. The same is the case with the stock markets, which is precisely where stock market breadth indicators come in handy—they are the pulse checkers of the market that help determine whether a majority of stocks are participating in a trend or if only a few big players are moving the market.
What Are Market Breadth Indicators?
Market Breadth Indicators are tools that gauge the overall participation of various stocks in a particular direction. They are key components of equity market breadth analysis, which examines how many stocks are gaining versus how many are losing. Instead of focusing on single indices like Nifty 50 or Sensex or making choices based on a few heavyweight stocks, these indicators go deeper by asking how many stocks are gaining versus how many stocks are losing. They, therefore, give a broader picture of the health of the market. There are more than 2,000 stocks listed, so checking them under their respective indices helps in decision-making. Market breadth can be checked for Nifty 50, Bank Nifty, Sensex, Micap Nifty, Nifty Smallcap 100, and so on.
Consider this example: If the Sensex goes up by 200 points but still 70% of stocks are down in the broader market, there is something amiss. This is when the market breadth analysis comes into play to reveal the real story.
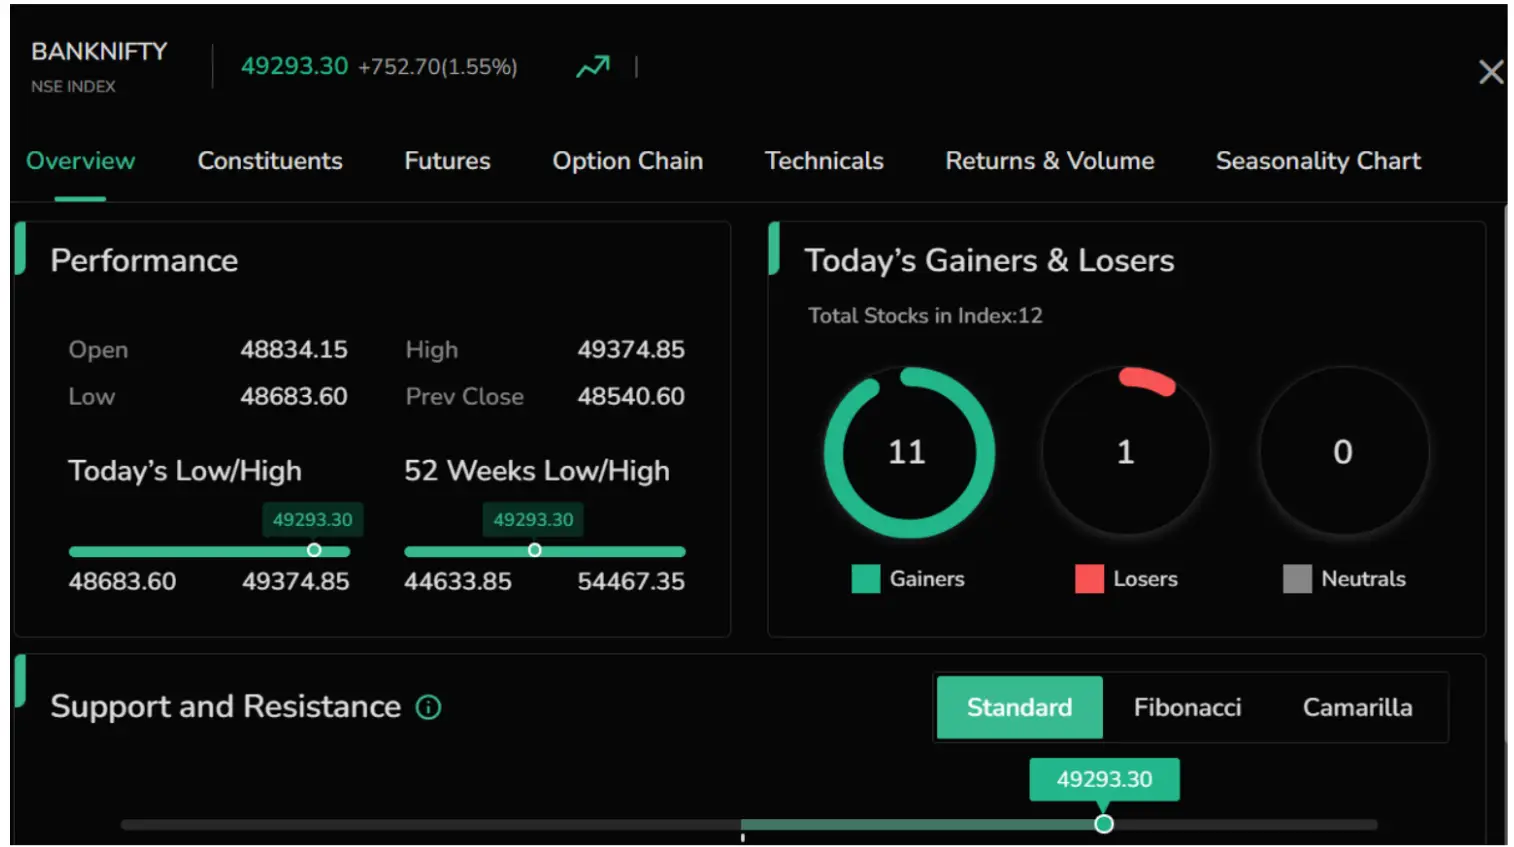
Gainers and Losers on Cubeplus can help to understand market breadth. Cubeplus, one of the top apps for trading stocks in India, provides real-time data on advancing and declining stocks, allowing traders to gauge market trends effectively.
Commonly Used Market Breadth Indicators:
Advance/Decline Ratio (A/D Ratio)
This is one of the simplest indicators, comparing the number of advancing stocks (those closing higher) with the number of declining stocks (those closing lower). A ratio greater than 1 means that more stocks are advancing, and generally this is considered to be bullish.
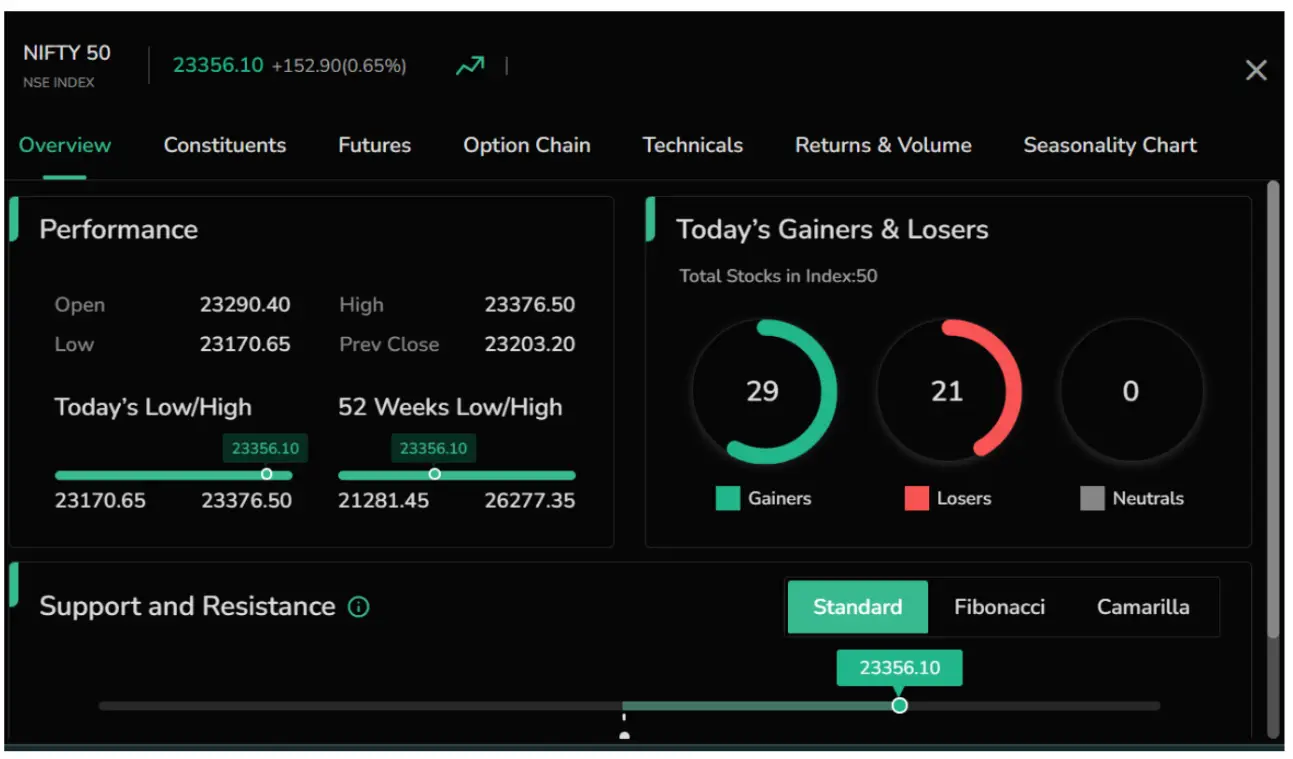
If there are 29 advancing and 21 declining, as shown in the image below:
AD Ratio = Advancing Stocks / Declining Stocks
29 / 21 = 1.38
AD Ratio = 1.38
Advance-Decline Line (A/D Line)
The A/D Line is calculated using the following formula:
A/D Line = Previous A/D Line Value + (Advances − Declines)
Advances: The number of stocks that closed higher than their previous close on a given day.
Declines: The number of stocks that closed lower than their previous close on the same day.
This cumulative calculation allows the A/D Line to reflect changes in market breadth over time, providing a running total that indicates whether more stocks are participating in market movements. The A/D line should ideally be used on longer time frames to get a clearer view of the market's breadth.
Example Calculation:
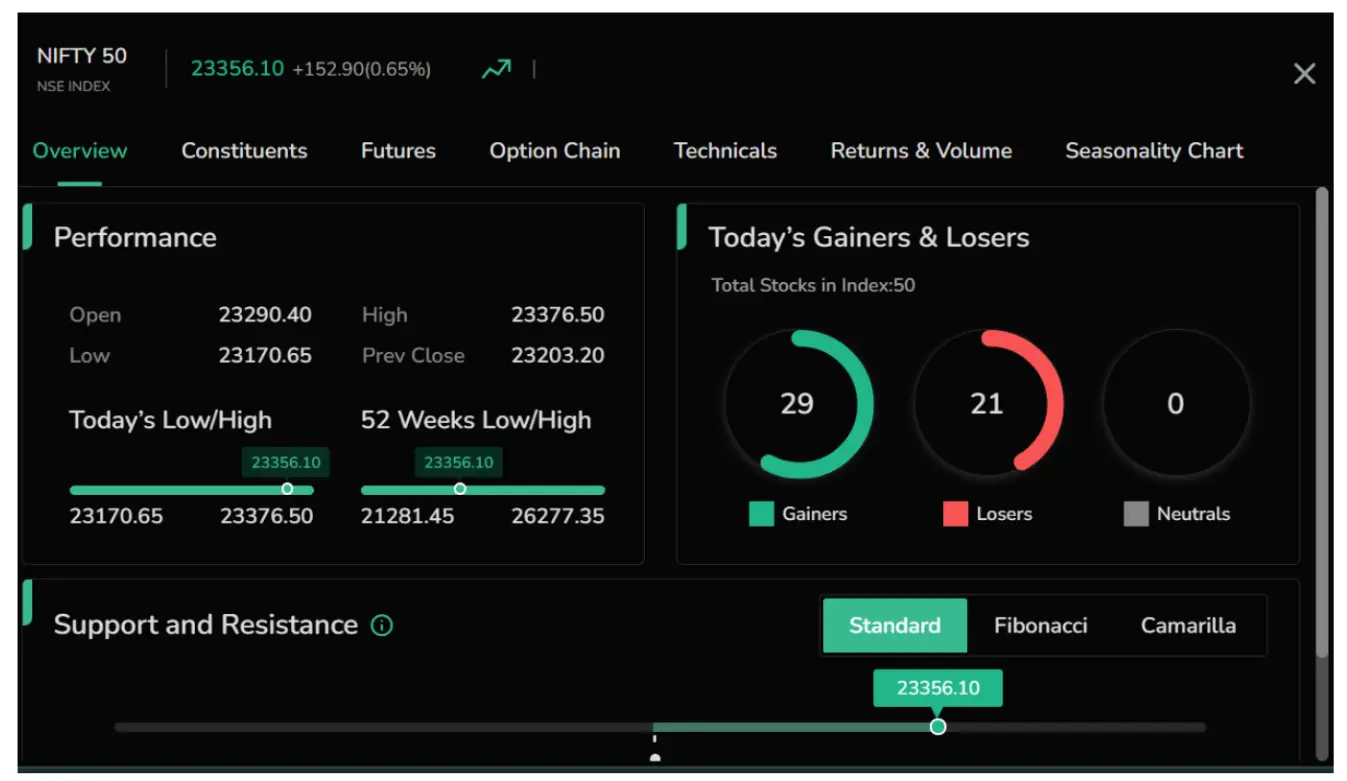
Day 1: In an index like Nifty 50, suppose 29 stocks are advancing and 20 are declining.
A/D Line = 29 − 20 = 9
Day 2: In the same index, suppose 35 stocks are advancing and 15 are declining.
This suggests that advances are increasing, reflecting a bullish trend.
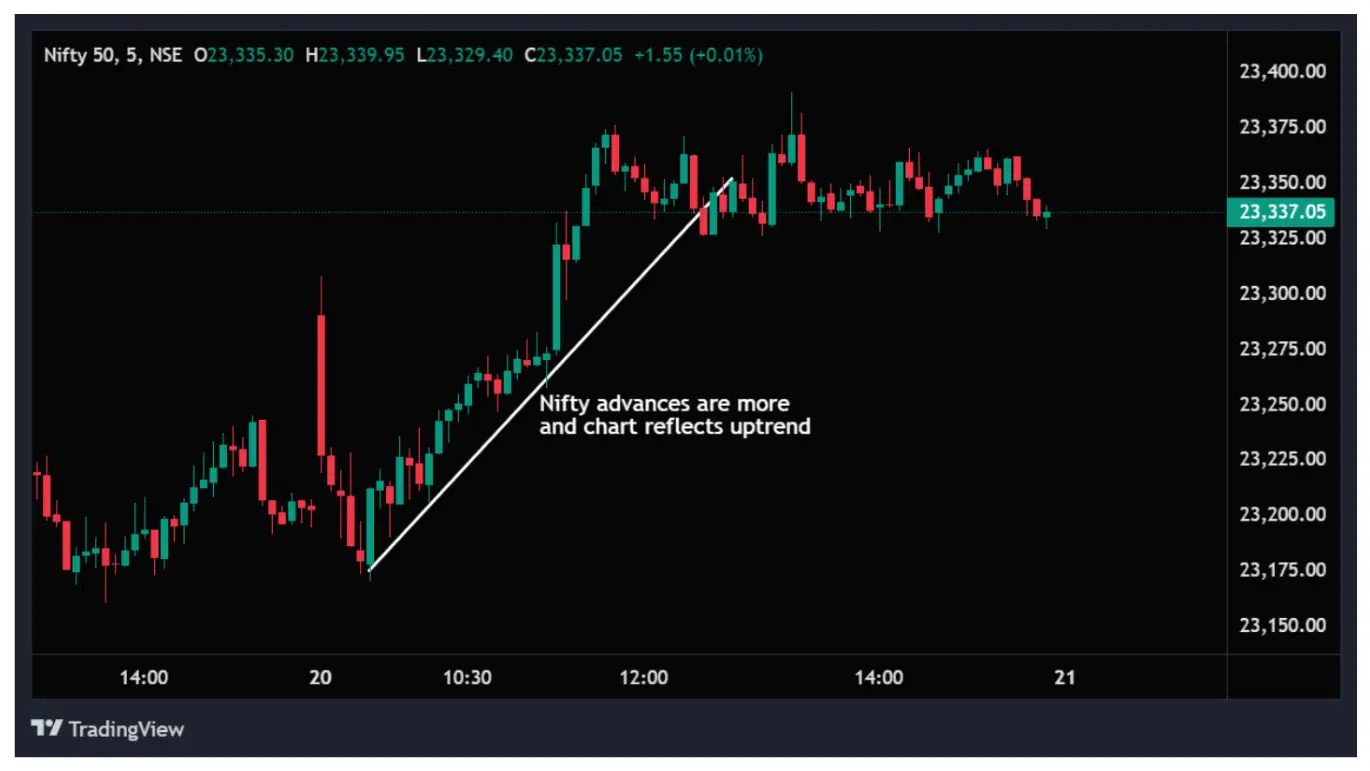
So, this indicates that there is strength in the market, which can be seen on the Nifty chart.
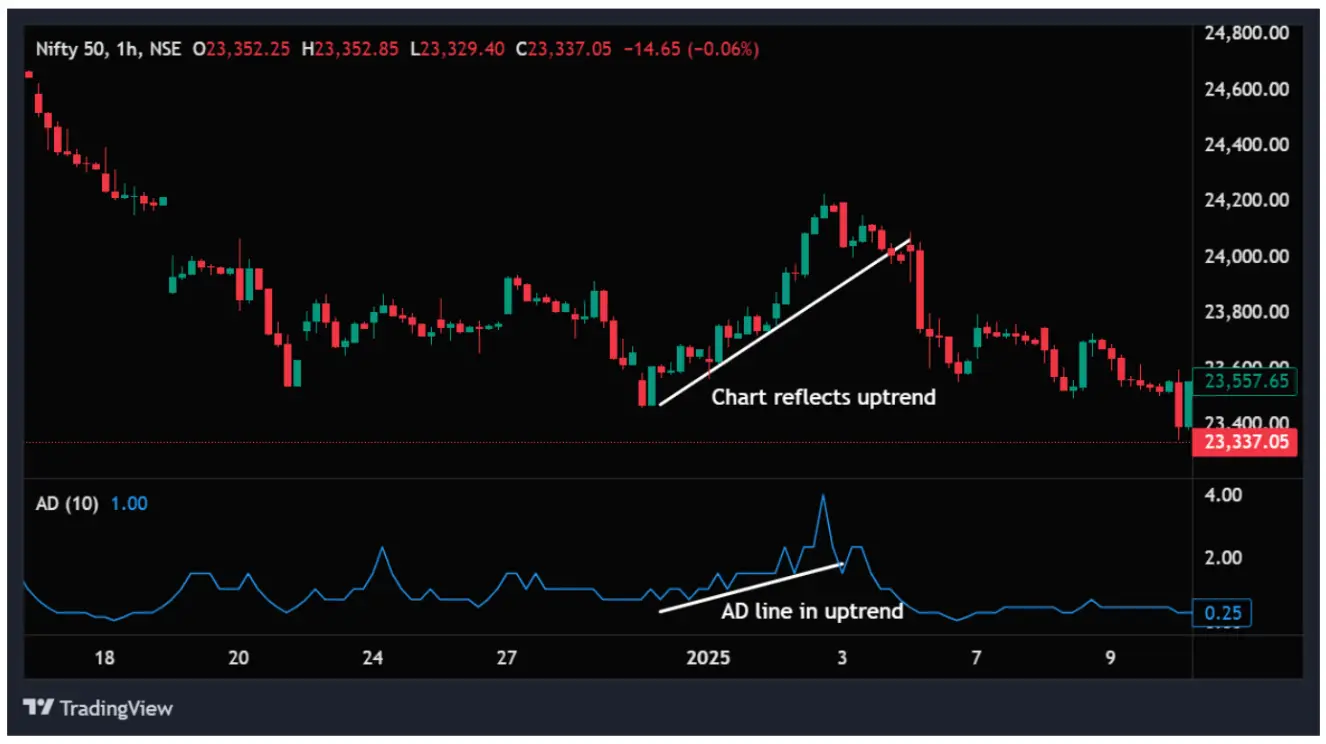
When the Advance-Decline (AD) Line is rising and the market index is also moving upward, it indicates strengthening market breadth as the number of advancing stocks increases. This image below reflects alignment and confirms that the trend is likely an uptrend.
In the image below, both the A/D line and the chart reflect an uptrend, which aligns with the increasing advances in the market.
- High-New Low Index: It keeps track of the number of stocks that spend their cracking at new 52-week highs as opposed to those that are cracking low. A market was when the new highs outnumbered the new lows, sounding healthy and bullish.
- McClellan Oscillator: An advanced indicator, the McClellan is based upon the difference between advances and declines within stocks. It works great when it comes to spotting overbought or oversold conditions within any market. The mcclellan oscillator formula I is based on Exponential Moving Averages (EMAs) of the difference between the number of advancing and declining stocks.
- Percentage of Stocks Above Moving Averages: This is a measure of the percentage of stocks trading above key moving averages (e.g., 50-day or 200-day). A high ratio typically indicates a strong market. To apply this indicator, you need to build your pine script and then run it on the chart.
More commonly used breadth indicators are advance-to-decline ratio and Advance decline line (AD line)
What do Market Breadth Indicators Tell Us?
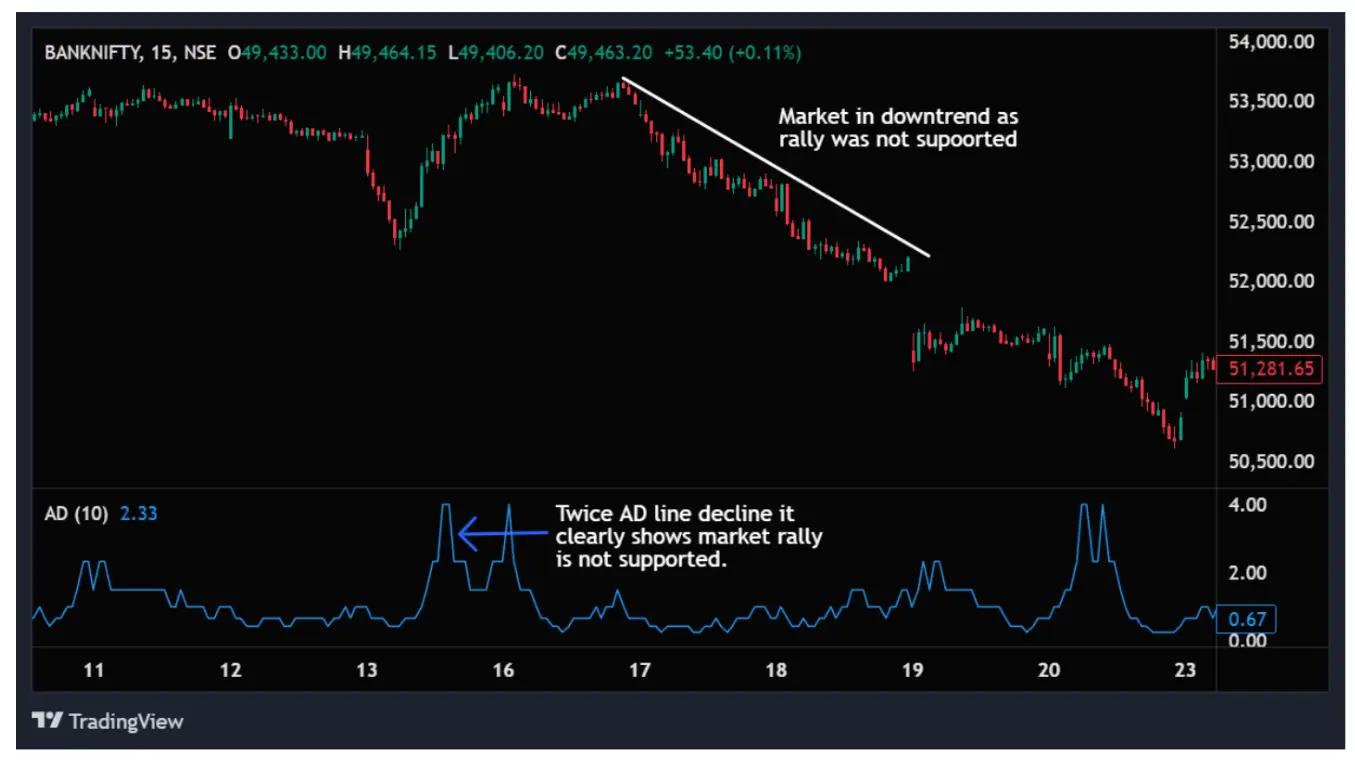
- Trend Confirmation: Market breadth can confirm whether a rally or decline enjoys broad support. For instance, when the Nifty makes new highs but the A/D Line is weakening, that means the rally was unsupported and might reverse sooner than expected.
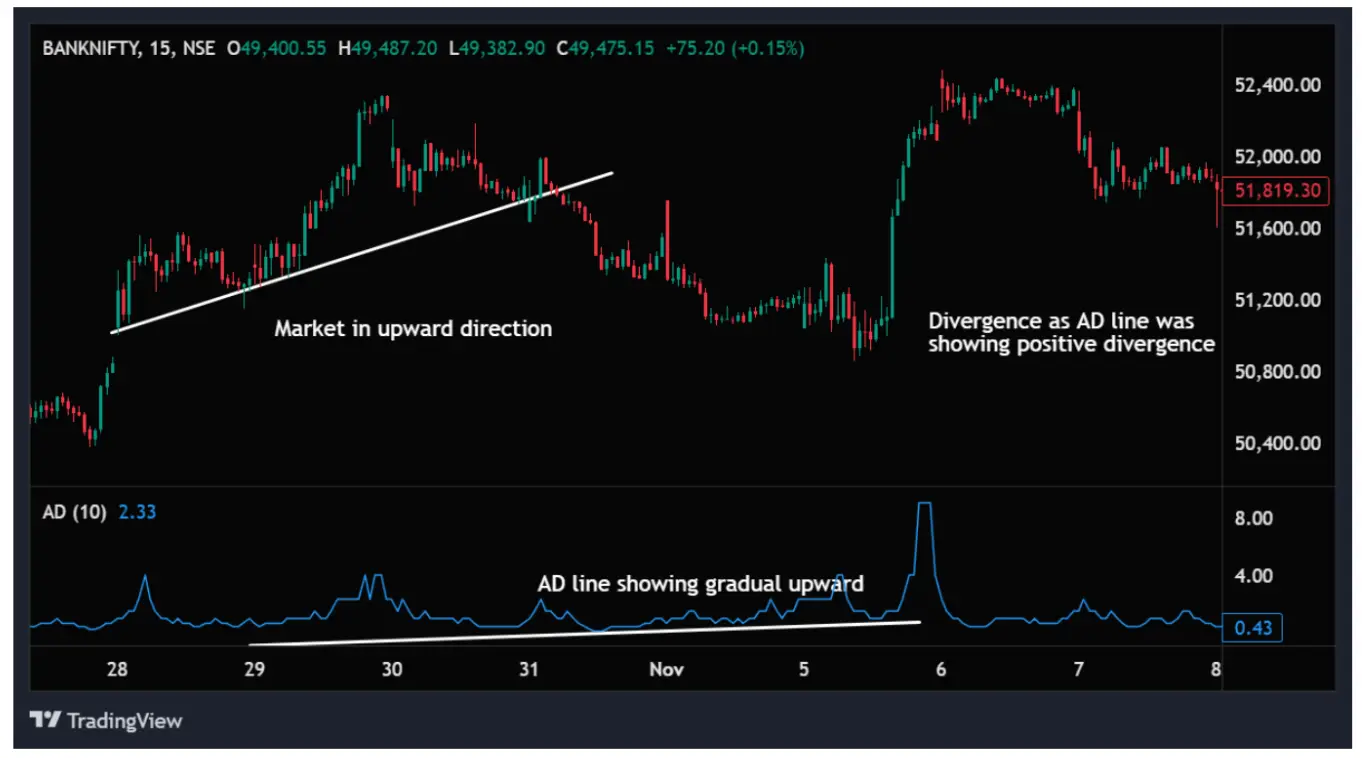
- Spotting Divergences: When divergences happen between market indices and breadth indicators, it often acts as a signal for turning points. A bullish divergence is created when breadth indicators are going up and the index is going down, which communicates an imminent upside reversal.
- Weakness Detection: Market breadth indicators may serve as the first alarm bells. Where not many stocks are setting out to take part in a rally, a weak market is identified that might sulk.
Why Should You Care?
For everyday investors, market breadth indicators provide insights that headline numbers often miss. They help you:
- Avoid FOMO (Fear of Missing Out): If only a few stocks are driving the market, it’s wise to be cautious instead of jumping in blindly.
- Identify Opportunities: Breadth indicators can help identify sectors or stocks that are steadily gaining momentum. It’s also essential to do market breadth analysis at the sector level to determine whether a stock's upward movement aligns with the overall performance of its sector.
- Reduce Risk: By understanding the market’s underlying health, you can make more informed decisions about when to enter or exit.
In Summary
Market breadth indicators thus provide crucial insight into market conditions beyond fluctuations in price movements. They reflect investor sentiment and, most importantly, the broader range of trend strength, assisting traders in decision-making. This can help market participants better navigate the complexities of the stock market and potentially achieve better investment performance. Whether you are seasoned in the market or a novice, embracing market breadth analysis can lead to better investments.
So, the next time you hear about the Sensex or Nifty setting record highs, stop for a moment to glance at the breadth indicators and check how many stocks in the indices are supporting the rally.
Written by Suchitra
24th Jan 2025 / 3 min read
Featured Posts

By Asma Torgal
8th July 2024
Stock Market Sentiment Drives Trading Decisions

By Tejaswi P
30th Aug 2024
Can Government Employees Do Trading in the Stock Market?
_11zon.webp?alt=media&token=bd974821-aee4-43a5-b467-01d1a67a570b)
By Suchitra
29th Mar 2025
Algo Trading in India Tech-Driven Strategies for Modern Investors
_20_11zon.webp?alt=media&token=6659b2e6-927e-42de-8375-e227e579f556)
By Asma Torgal
28th Mar 2025
Trading Across Time Zones, The Global Market Timings in IST
By
Fri Mar 21 2025
How to Use Parallel Channels, Trends & Patterns
_11zon.webp?alt=media&token=a8f3f55c-dc70-4d42-844e-6874ceff69ce)
By Suchitra
20th Mar 2025
Swing and Positional Trading with Pivot Points
_11zon.webp?alt=media&token=a05d2324-cace-44ed-a35f-50f9e63be9c3)
By Suchitra
13th Mar 2025
How Central Banks Influence Indian Stock Market Trends
_11zon.webp?alt=media&token=14cd8f87-8add-49ce-84f1-ca07a0c52b0c)
By Suchitra
12th Mar 2025
Two Essential Candlestick Patterns for Market Timing

By Suchitra
05th Mar 2025
How Algorithmic trading revolutionizes modern markets with efficiency and speed

By Asma Torgal
24th Sep 2024
Lot Size in Futures & Options Trading