
Swing and Positional Trading with Pivot Points
_11zon.webp?alt=media&token=a8f3f55c-dc70-4d42-844e-6874ceff69ce)
Pivot points are essential tools for swing and positional trading, acting as dynamic support and resistance levels to guide market entries and exits. Traders use daily, weekly, and monthly pivot points to identify breakouts, reversals, and trend confirmations. Effective strategies include pure pivot trading, pivot points + moving averages for trend confirmation, and pivot points + RSI for reversal signals. Managing risk through stop-loss placements, position sizing, and market monitoring is key to success. Combining pivot points with technical indicators enhances trade precision, making them a valuable addition to long-term trading strategies.
If you have spent time exploring the world of trading, you have probably come across various styles—intraday, swing, and positional trading. Each has a distinct time horizon, risk tolerance, and approach. While intraday traders feed on fast price action within one day, swing and positional traders step back to await wider trends that unfold over days, weeks, or even months. Patience and self-control are necessary to these longer-term plans, and that is where the idea of pivot points fits into place.
Pivot points are also a popular technical analysis tool used to help the trader determine notable support and resistance levels. Levels are indicators ( provides indication ) when price trends would reverse or extend, and for this reason, they are especially valuable for swing and positional trading. By implementing pivot points as part of a strategy, a trader can make the decision process better and further optimize trade timing.
Pivots points act like support and resistance
Pivot points help traders identify key support and resistance levels where price movements may either reverse or continue. They act as reference points in the ever-changing market landscape.
-
Support and Resistance Mapping: Pivot points highlight probable zones where buying or selling pressure intensifies.
-
Market Sentiment Gauge: If the price is above the pivot, the trend signifies bullish; if below, bearish sentiment dominates.
-
Decision-Making Simplification: Traders use pivot levels as predefined action zones.
Choosing the Right Timeframes for Pivot Points
As swing and positional traders target longer trends, they employ wider timeframes than intraday traders. The best pivot point timeframes are:
| Pivot Point Type | Best Suited For |
|---|---|
| Daily Pivot Points | Multi-day trades |
| Weekly Pivot Points | Medium-term trades |
| Monthly Pivot Points | Long-term positions |
By observing price action at these pivot points, the trader can determine where the price may reverse or continue its trend.
Making Quick Decisions Using Pivot Points
Pivot points make trading decisions easier by giving predetermined support and resistance levels. Traders are able to:
-
Measure market sentiment: If the price remains above the pivot point, sentiment is bullish—supporting buying opportunities. If below, sentiment is bearish—supporting selling opportunities.
-
Spot breakouts: Breaking above the first resistance (R1) indicates a move towards R2 or R3, and breaking below the first support (S1) indicates a fall towards S2 or S3.
-
Trade reversals: When price touches a pivot level and then reverses, it offers scope for counter-trend trades.
Managing Risk in Swing and Positional Trading
Holding trades for longer periods exposes traders to market gaps and unexpected volatility. To mitigate risks, traders should:
-
Set Stop Losses: In an uptrend, place stop-loss orders below key support levels. In a downtrend, set them above resistance levels.
-
Manage Position Sizing: Risk a fixed percentage of capital per trade to control potential losses.
-
Monitor Market Trends: Pivot points work best when combined with moving averages, price action, and other technical indicators.
Key Trading Strategies Using Pivot Points
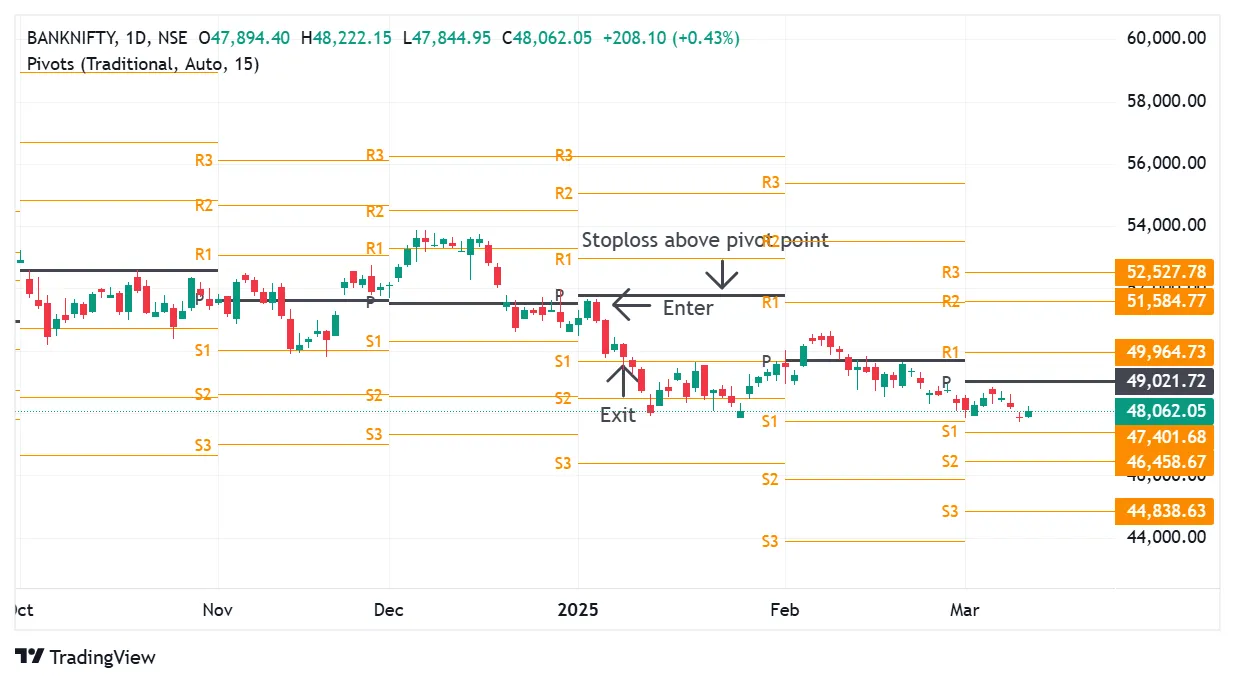
1. Pure Pivot Points Approach
- Ideal for: Stocks and indices
- Timeframes: 1 hour, 4 hours,Daily, weekly, and monthly charts
- Indicators Used: Pivot Point Standard
Guidelines for Analysis:
If the price is above the pivot point, look for buying opportunities. If the price is below the pivot point, look for selling opportunities. Breakouts above R1 or below S1 signal potential trend continuation.
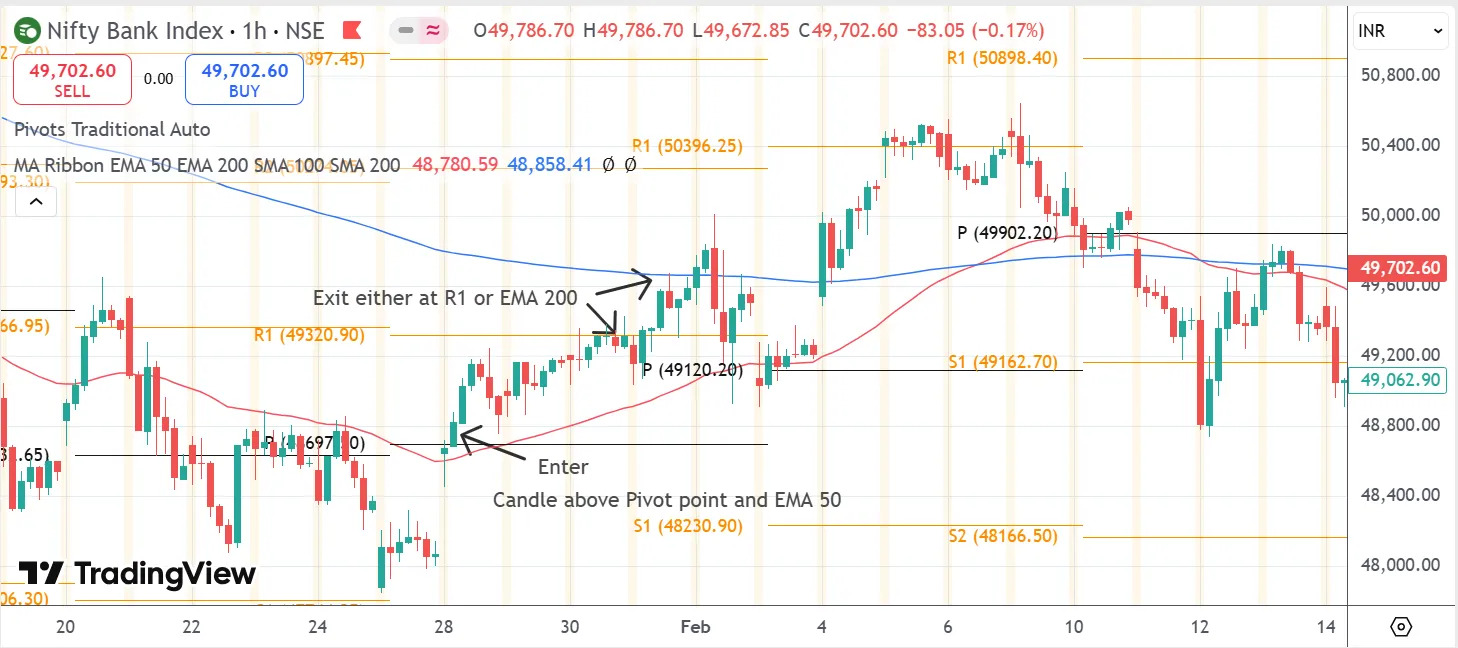
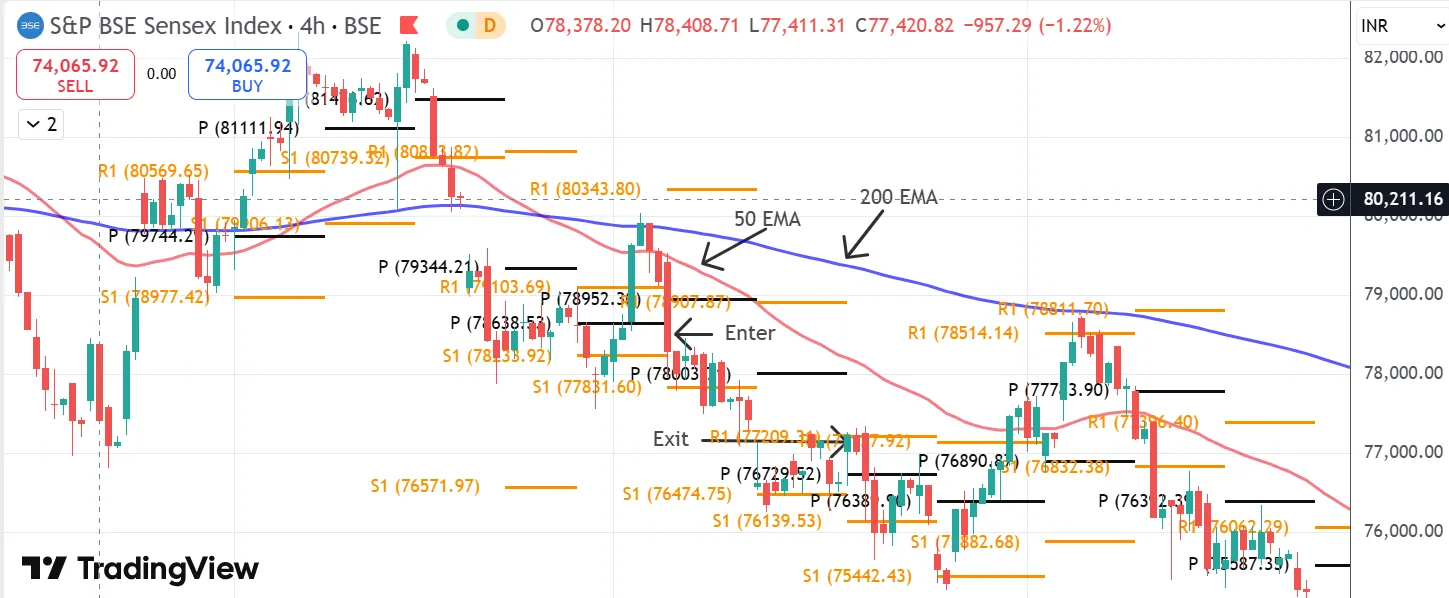
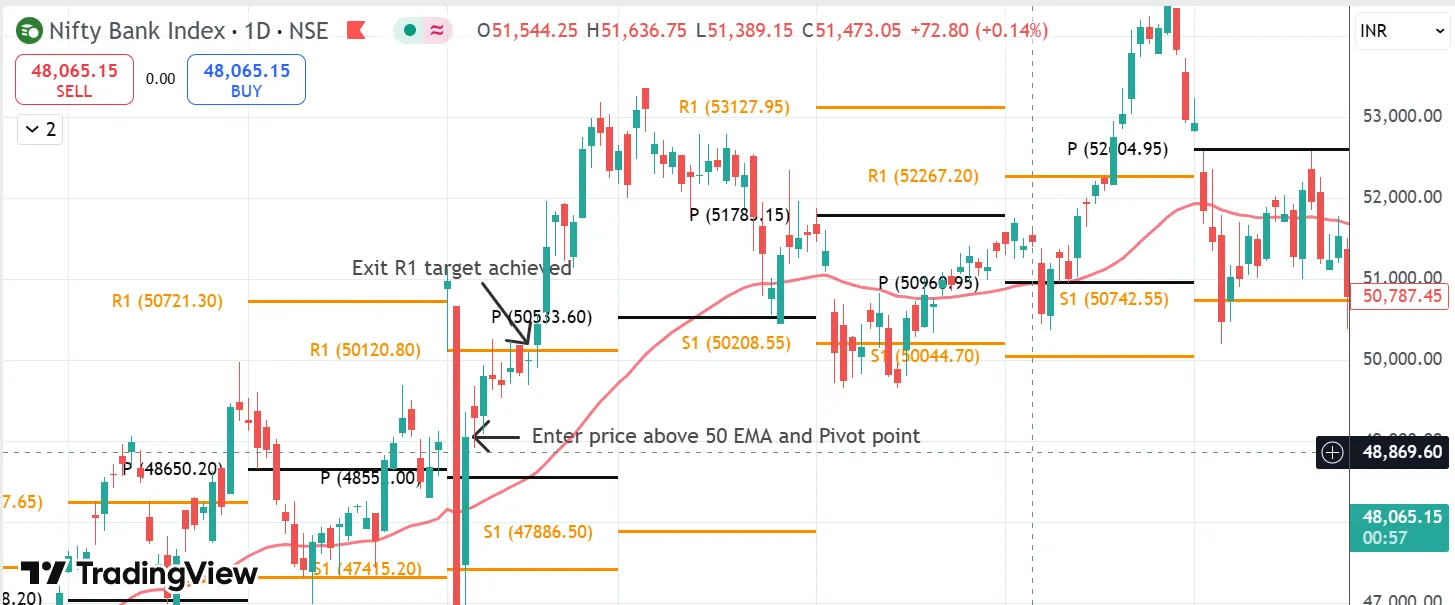
2. Pivot Points + Moving Averages approach for Trend Confirmation
- Ideal for: Stocks and indices
- Ideal Timeframes: 1hour, 4 hours,Daily and weekly charts
- Indicators Used: Pivot Points + 50-day and 200-day Moving Averages
Guidelines for Analysis:
If the price is above the pivot point and the 50-day moving average (MA), it confirms a strong bullish trend—ideal for long trades. If the price is below the pivot point and the 50-day MA, it confirms a bearish trend—ideal for short trades. The 200-day MA acts as a long-term trend filter.
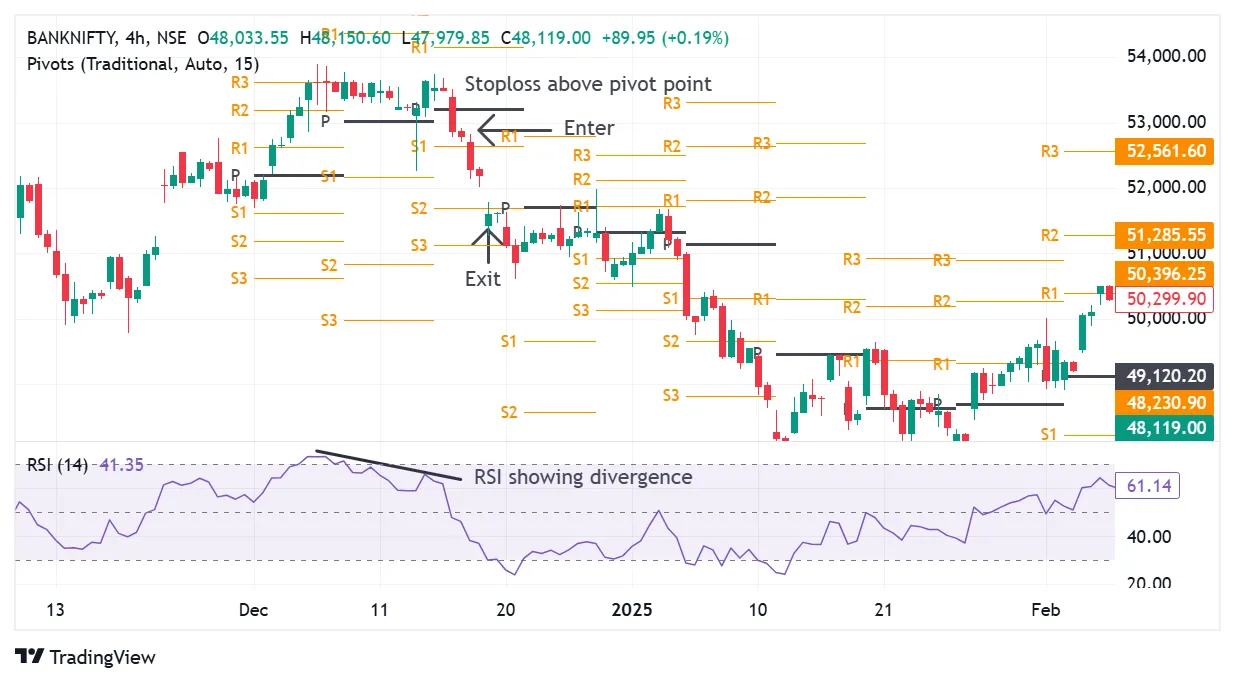
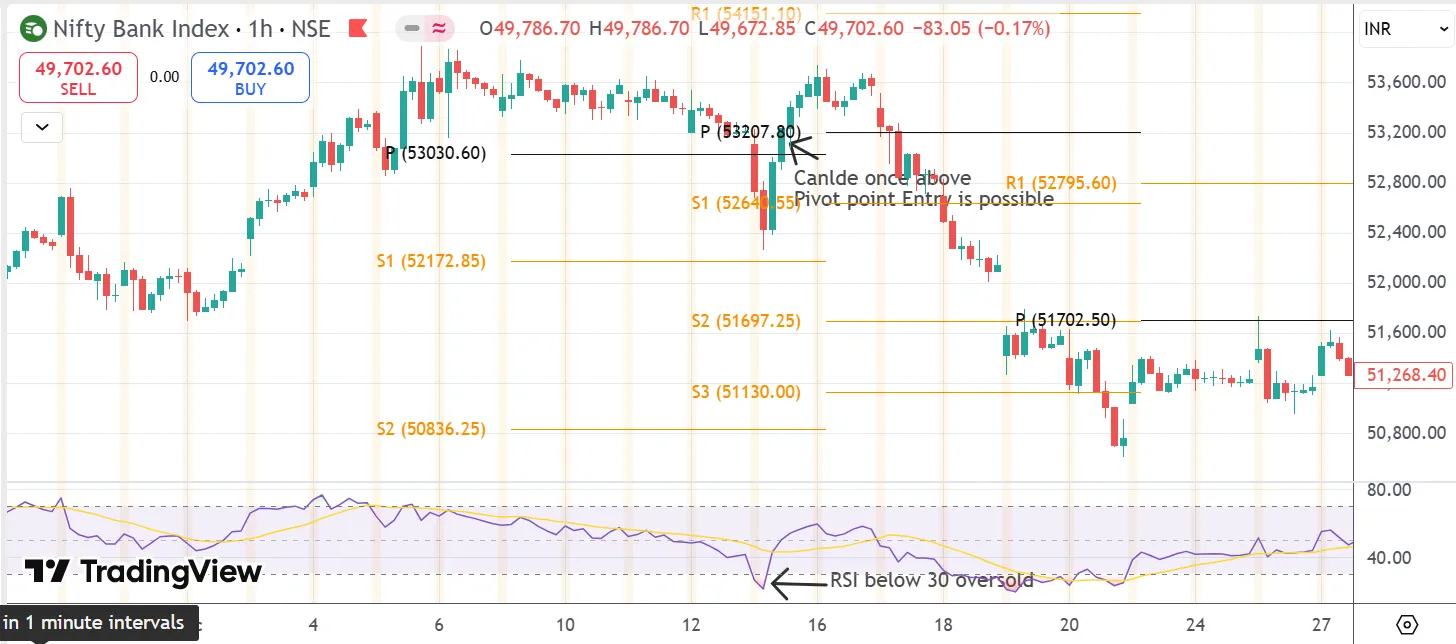
3. Pivot Points + RSI Approach for Reversal Signals
- Suitable for : Stocks and indices
- Ideal Timeframes: Hourly,Daily and weekly charts
- Indicators Used: Pivot Points + RSI (Relative Strength Index)
Guidelines for Analysis:
If the price reaches above pivot point and RSI is below 30, it signals a potential bounce (buy opportunity). If the price reaches below the pivot point and RSI is above 70, it signals a potential reversal (sell opportunity). Combining RSI with pivot point breakouts provides stronger confirmation.
Note : The trend should be considered to avoid getting into trap.
Key takeaways
Traders should evaluate their trading style, market conditions, risk tolerance, and adaptability. Swing traders may access daily and weekly pivot points, while positional traders may focus on monthly pivot levels. Market conditions also play an important role; pivot points work well in both trending and range-bound markets but should be used with other indicators. Risk tolerance is another factor to keep in mind, as positional trades expose traders to overnight risks and price gaps, making proper stop-loss strategies essential. On the other hand, no strategy is foolproof, so continuous backtesting and adaptation are necessary to refine the approach based on market changes. Pivot points act as a guiding tool, but reward ultimately depends on disciplined execution and strategic decision-making.
Disclaimer: This article is for educational purposes only and does not constitute financial advice. Please consult a certified financial advisor before making any investment decisions.
Written by Suchitra
20th Mar 2025 / 5 Mins Read
Featured Posts

By Asma Torgal
8th July 2024
Stock Market Sentiment Drives Trading Decisions

By Tejaswi P
30th Aug 2024
Can Government Employees Do Trading in the Stock Market?
_11zon.webp?alt=media&token=bd974821-aee4-43a5-b467-01d1a67a570b)
By Suchitra
29th Mar 2025
Algo Trading in India Tech-Driven Strategies for Modern Investors
_20_11zon.webp?alt=media&token=6659b2e6-927e-42de-8375-e227e579f556)
By Asma Torgal
28th Mar 2025
Trading Across Time Zones, The Global Market Timings in IST
By
Fri Mar 21 2025
How to Use Parallel Channels, Trends & Patterns
_11zon.webp?alt=media&token=a05d2324-cace-44ed-a35f-50f9e63be9c3)
By Suchitra
13th Mar 2025
How Central Banks Influence Indian Stock Market Trends
_11zon.webp?alt=media&token=14cd8f87-8add-49ce-84f1-ca07a0c52b0c)
By Suchitra
12th Mar 2025
Two Essential Candlestick Patterns for Market Timing

By Suchitra
05th Mar 2025
How Algorithmic trading revolutionizes modern markets with efficiency and speed
By Asma Torgal
24th Sep 2024
Lot Size in Futures & Options Trading

By Asma Torgal
9th sep 2024
Algo Trading

.webp?alt=media&token=e5d95699-b957-4e1c-8088-02ec5c882b8c)