
How to Use Bollinger Bands for Better Trade Decisions
This article explains Bollinger Bands, a key trading tool combining moving averages with volatility. It covers strategies like identifying squeezes, trading within bands, and spotting double bottoms to improve market timing and decisions.
Have you ever noticed those three lines on your trading screen that track a stocks price movement. These lines form the Bollinger Bands, a widely used technical indicator that helps traders analyze market conditions. Developed by financial analyst John Bollinger in 1983, this tool combies moving averages with volatility to highlight potential buying and selling opportunities. In this article you will learn how bollinger band in stock market work, key strategies like identifying the squeeze, trading within the bands and spotting double bottoms. By the end, you will understand how to use this indicator to improve your market timings and make more informed trading decisions.
Basics of Bollinger Bands
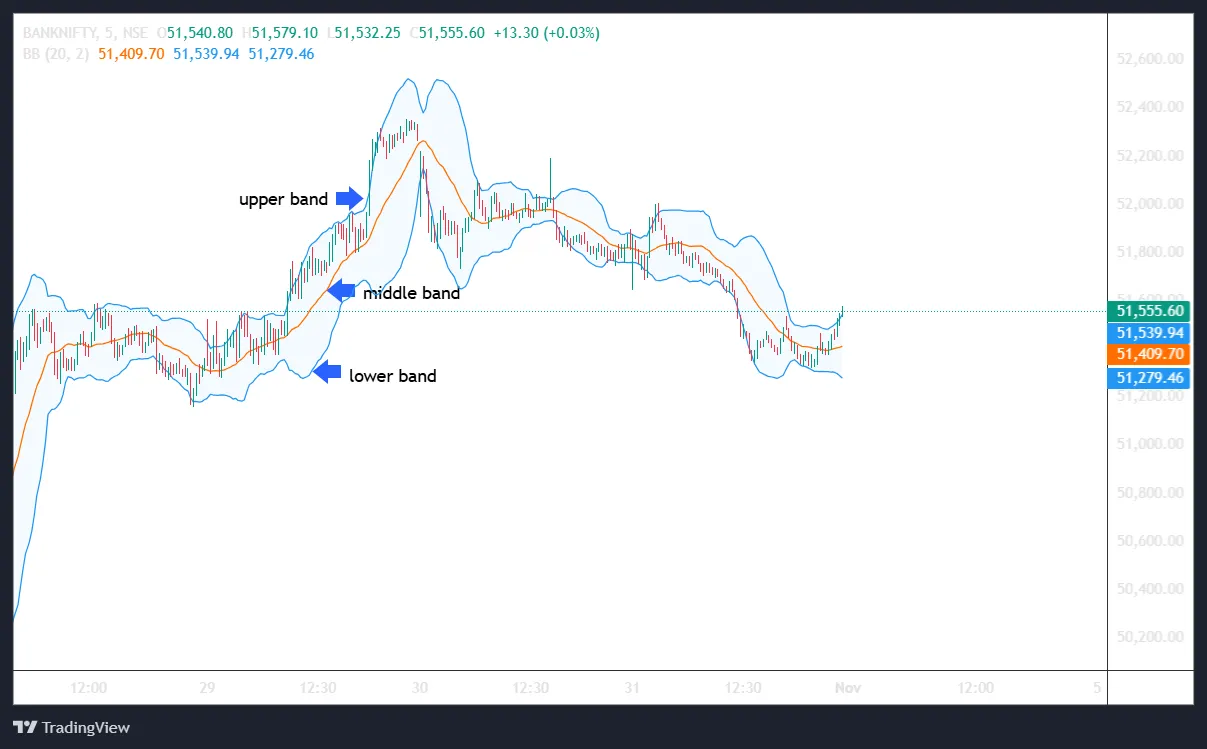
Bollinger Bands consist of three lines:
- Middle Band: A Simple Moving Average (SMA), often a 20-day moving average that reflects the average price trend.
- Upper Band: Plotted two standard deviations above the SMA.
- Lower Band: Plotted two standard deviations below the SMA.
Understanding Bollinger Bands means recognizing that narrow bands signal low volatility and stable prices, while wider bands suggest high volatility and larger price swings. Using techniques like the squeeze, trading within the bands, and spotting double bottoms can help identify opportunities. For best results, combine them with other tools and analysis to improve trend-spotting and market timing!
Interpreting Bollinger Bands Bollinger Bands are more than just lines; they can reveal market conditions and trends through their spacing and the price’s interaction with the bands.
Best Bollinger Bands Trading Strategy
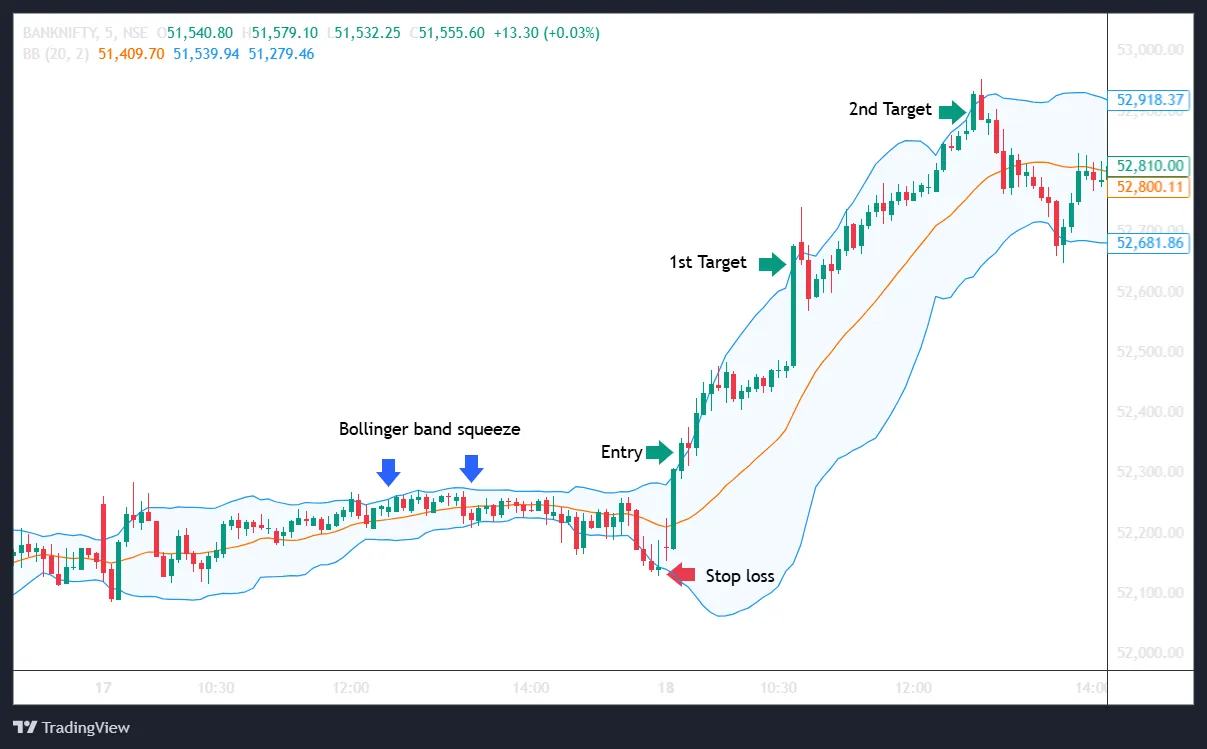
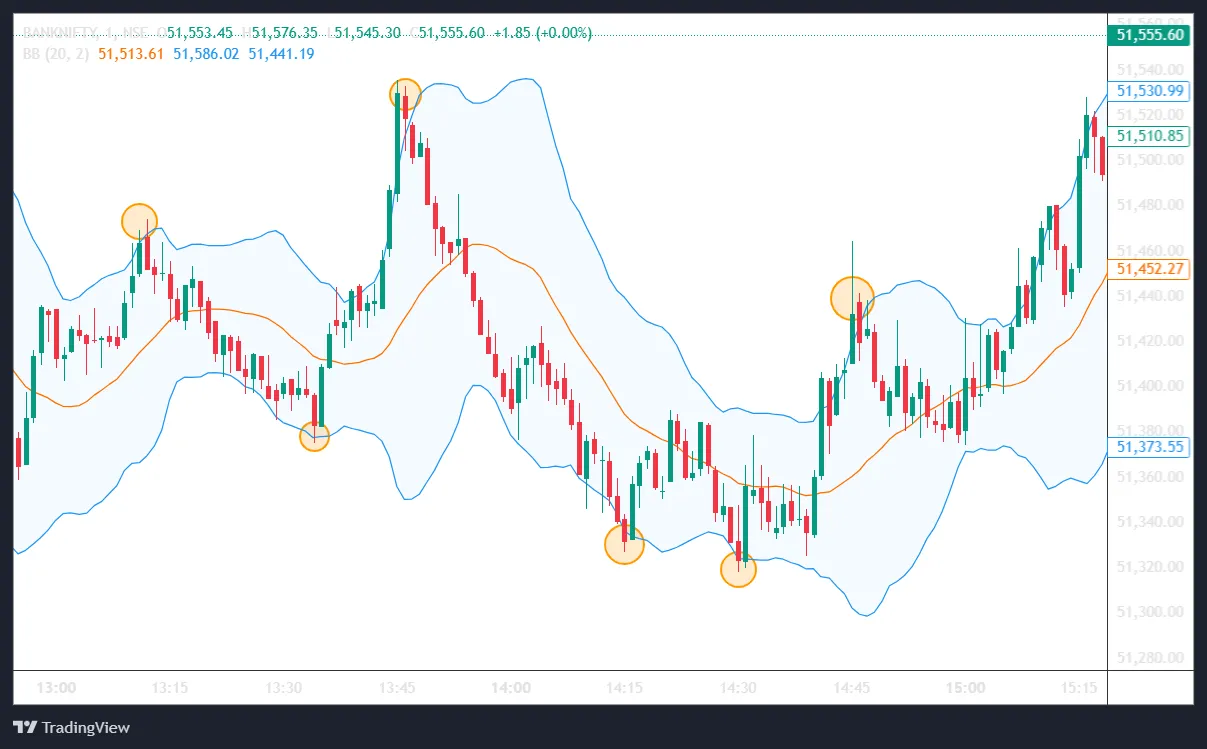
1. Bollinger Band Squeeze
It is the situation that occurs when the bands contract. This depicts low volatility and can indicate a major breakout either an advance or decline in the prices in near future.Below chart depicts bollinger band squeeze.
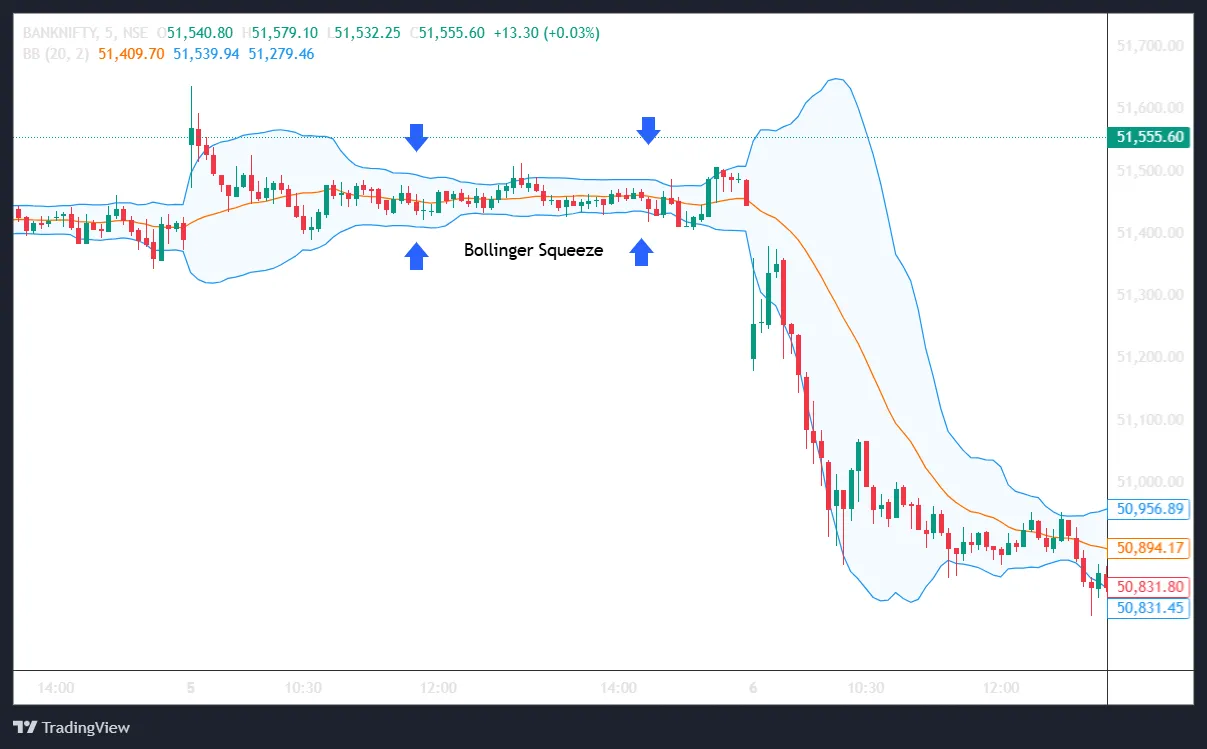
Trading with Bollinger band squeeze.
Identify the Squeeze:
- A squeeze occurs when the Bollinger Bands narrow, signaling low volatility. This often happens before a big price move.
- Look for a period where the bands are tight around the price. This is the ’squeeze,’ indicating the market is gearing up for a breakout.
Wait for a Breakout:
- Once you spot a squeeze, wait for the price to break out of the bands. This is a signal that the price might start moving strongly in one direction.
- A breakout candle moving above or below the bands gives the go-ahead for your trade.
Setting the Stop Loss:
- Place a stop loss below the lower band of the Bollinger Band squeeze if you’re buying, or above the upper band if you’re shorting. This protects you if the breakout reverses unexpectedly.
Profit Targets:
- Initial Target: Set your first target around the upper Bollinger Band. As soon as the price hits it, consider selling some of your position to lock in profits.
- Trailing for a Bigger Move: After reaching the first target, hold onto the remaining position and use a trailing stop to follow the trend. This way, you can capture a larger price movement if the breakout continues.
2. Bollinger Band Squeeze
For low-risk investors seeking steady, modest returns, using the Simple Moving Average (SMA) as a buy-sell signal can be effective. This strategy works by buying when prices dip below the SMA and selling when they rise above it, taking advantage of the natural price swings around the average. It’s especially useful in low-volatility markets, offering a stable approach where returns accumulate over time without the need for high-risk trades.
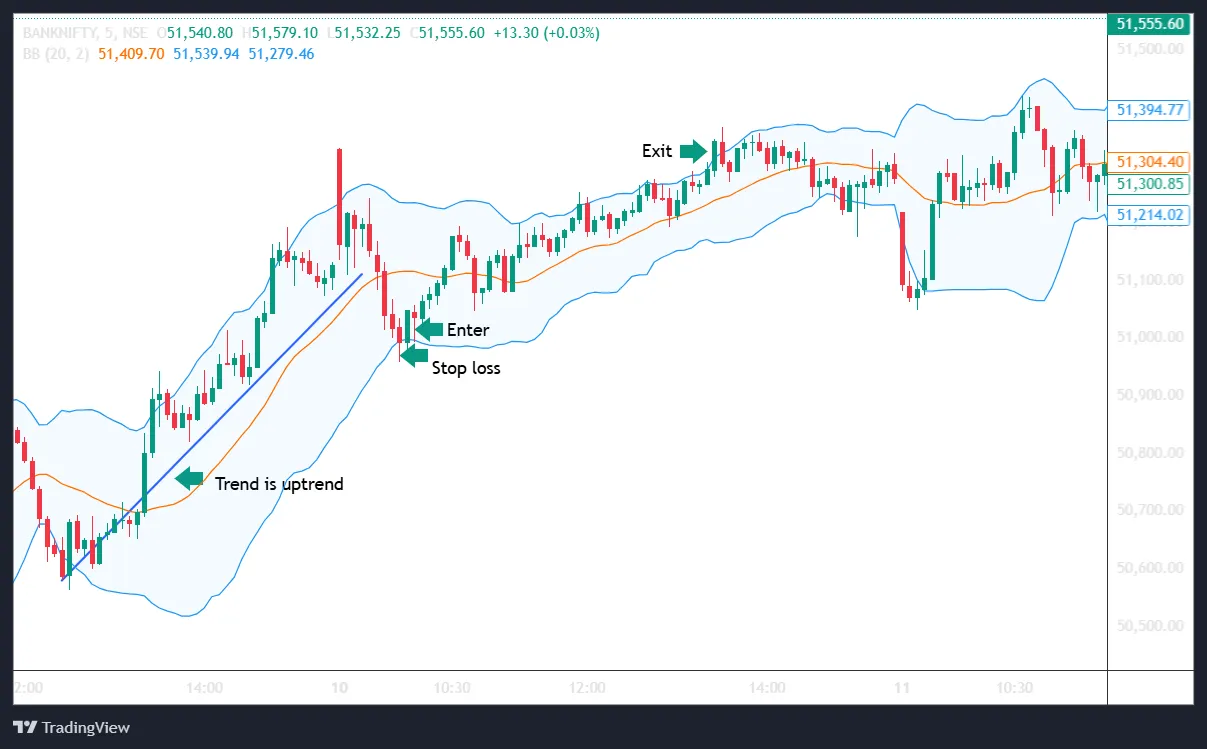
Strategy 1: Trading Within the Bands Strategy
In an uptrend, the Bollinger Bands can help pinpoint low-risk entry points. Here’s a simple approach:
- Wait for a Pullback: In an uptrend, allow the price to retrace down to the middle or lower band.
- Enter the Trade: When the price reaches the lower band, it’s a potential entry signal.
- Set a Stop Loss: Place a stop loss below the low of the candle just before your entry candle, to manage risk.
- Target the Upper Band: Set your profit target around the upper band, where you can look to take profits as the price rises.
Strategy 2: Identifying Overbought and Oversold Levels:
-
Overbought: When prices approach the upper band, it signals an overbought condition. This can be a potential sign of a price correction.
-
Oversold: When prices near the lower band, it suggests an oversold condition, hinting at a possible price rebound.
Mean Reversion Strategy:
Bollinger Bands work on the concept of mean reversion, meaning prices tend to revert to the average. In range-bound markets, this approach can be beneficial:
-
Going Long: When prices touch the lower band, a trader might consider buying, expecting the price to move back toward the average.
-
Going Short: When prices hit the upper band, a trader may consider selling, anticipating a downward correction.
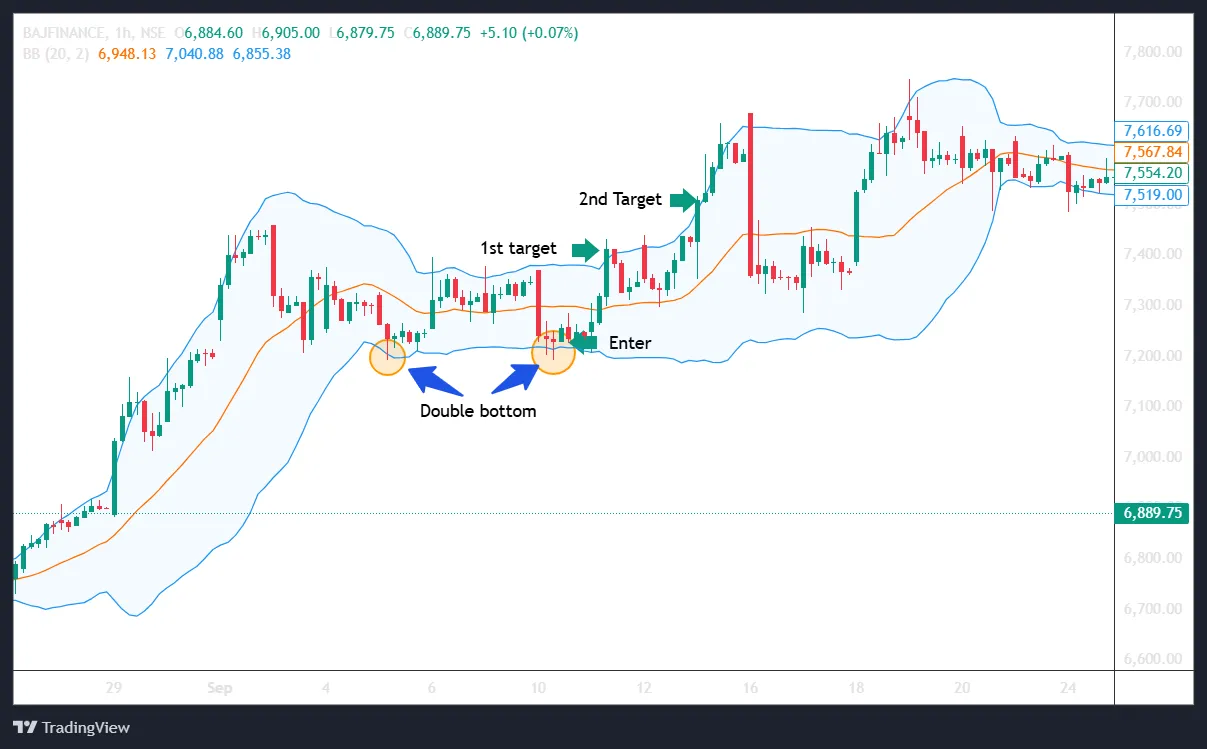
3. Double Bottom
A double bottom is a bullish chart pattern that signals a potential reversal from a downtrend to an uptrend. It’s called a "double bottom" because it resembles the letter "W," with two low points (bottoms) and a peak in between.
Once you spot a double bottom pattern, here’s a simple way to trade it:
- Enter the Trade:
Wait for a bullish candle to form near the lower band after the second bottom. This is your entry signal.
- Set Stop Loss:
Place a small stop loss just below the recent low near the lower band. This minimizes risk.
- Set Targets:
First Target:
Aim for the middle or upper band as your first target. Take partial profits here.
Trail the Rest:
Keep the remaining position and trail your stop loss as the price moves higher. Exit when the price reaches the upper band again.
Conclusion
Bollinger Bands are a powerful tool that can help you navigate the markets with more confidence, especially for Bollinger Band day trading and Bollinger Band for intraday strategies. By understanding how they work and applying techniques like the squeeze, trading within the bands, and spotting double bottoms, you can identify potential opportunities and make more informed trading decisions. However, like any technical indicator, they are most effective when used alongside other tools and market analysis. Keep practicing, refine your strategy, and over time, you will improve at spotting trends and enhancing your market timing!
Written by Suchitra
13th Feb 2025 /
Featured Posts

By Asma Torgal
8th July 2024
Stock Market Sentiment Drives Trading Decisions

By Tejaswi P
30th Aug 2024
Can Government Employees Do Trading in the Stock Market?
_11zon.webp?alt=media&token=bd974821-aee4-43a5-b467-01d1a67a570b)
By Suchitra
29th Mar 2025
Algo Trading in India Tech-Driven Strategies for Modern Investors
_20_11zon.webp?alt=media&token=6659b2e6-927e-42de-8375-e227e579f556)
By Asma Torgal
28th Mar 2025
Trading Across Time Zones, The Global Market Timings in IST
By
Fri Mar 21 2025
How to Use Parallel Channels, Trends & Patterns
_11zon.webp?alt=media&token=a8f3f55c-dc70-4d42-844e-6874ceff69ce)
By Suchitra
20th Mar 2025
Swing and Positional Trading with Pivot Points
_11zon.webp?alt=media&token=a05d2324-cace-44ed-a35f-50f9e63be9c3)
By Suchitra
13th Mar 2025
How Central Banks Influence Indian Stock Market Trends
_11zon.webp?alt=media&token=14cd8f87-8add-49ce-84f1-ca07a0c52b0c)
By Suchitra
12th Mar 2025
Two Essential Candlestick Patterns for Market Timing

By Suchitra
05th Mar 2025
How Algorithmic trading revolutionizes modern markets with efficiency and speed
By Asma Torgal
24th Sep 2024
Lot Size in Futures & Options Trading

