Mastering Pivot Points Strategy for Intraday Trading
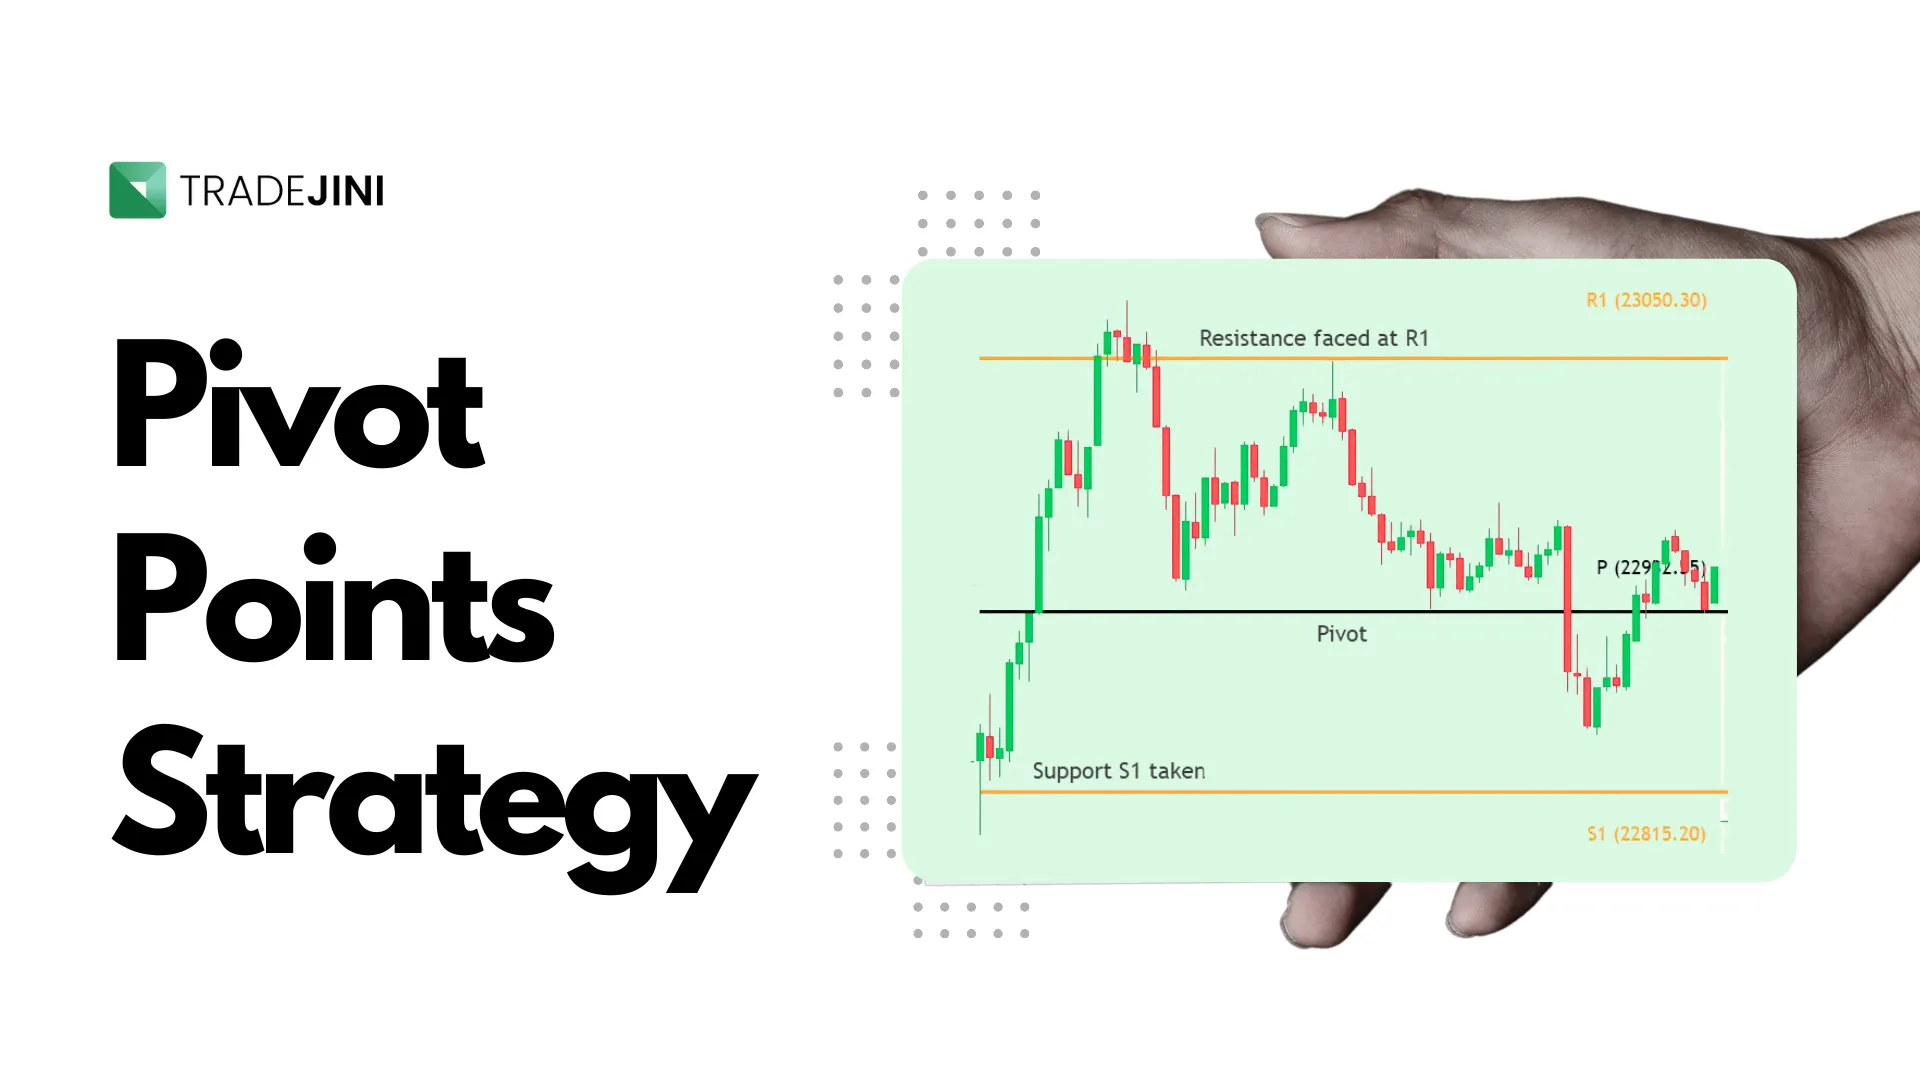
Pivot points are essential for intraday traders, offering reliable support and resistance levels. This guide explains how to trade using pivot points and enhance accuracy by combining them with MACD and RSI for trend confirmation and reversal signals.
If you do intraday trading, you would have probably wondered how to predict the market movement more accurately. This is where pivot points come in. They are used in many technical analysis systems, helping traders to find support and resistance levels where the price might reverse or continue trending.
In this guide, you will learn how to use pivot points in intraday trading, how to pair these points with MACD and RSI for better confirmation, and most importantly, how to implement these techniques in your trades. From trading stocks to indices to trading options, pivot points can offer a wealth of slick trading opportunities.
What are Pivot Points?
A pivot point is a technical analysis indicator used to determine the overall market trend over different time frames. It’s calculated using the previous day's high, low, and closing prices to identify potential support and resistance levels for the current trading day.
If the price trades above the pivot point, it suggests a bullish trend, while trading below it indicates a bearish trend. Traders use these levels to plan entry and exit points, as well as to set stop-loss orders, aiding in effective risk management.
Why Combine Pivot Points with MACD or RSI?
Working off of only one indicator is like driving through fog, while only using your headlights to guide you; you will be able to see something, but it is not always going to be entirely clear. This is why seasoned traders use pivot points alongside momentum indicators such as MACD and RSI.
-
MACD + Pivot: Confirming momentum and trend.
-
RSI + Pivot Points: Finding Overbought/Oversold Conditions Across Key Levels.
Using these indicators together ensures you are not entering trades blindly. Instead of jumping in just because the price reaches a pivot level, you wait for confirmation from MACD or RSI, improving accuracy and reducing false signals.
How to Add Pivot Points to Your Chart
If you are using the CubePlus platform, follow these simple steps:
-
Login to CubePlus: Access your trading platform by logging in.
-
Open Indicators Section: Navigate to the indicators tab on your chart.
-
Search for 'Pivot Point Standard': Type it in the search bar and select it.
-
Apply to Chart: Once added, the indicator automatically displays support and resistance levels.
Now, let us break down how to trade effectively using these levels.
Understanding Support and Resistance with Pivot Points
Before diving into pivot points, let us cover the basics of support and resistance:
-
Resistance: If a stock's price rises to a certain level and then starts falling, that level acts as resistance. Sellers begin to book profits, increasing supply and pushing prices lower.
-
Support: When a stock’s price falls to a level and then bounces back up, that level acts as support. Buyers step in at this point, creating demand and pushing prices higher.
Breakouts and Bounces
-
Breakout: When the price crosses a pivot level and sustains above or below it, it signals a potential trend continuation.
-
Bounce: When the price touches a pivot level and reverses, it signals a possible reversal trade.
By watching these levels closely, you can make better entry and exit decisions.
Intraday Trading Strategies Using Pivot Points
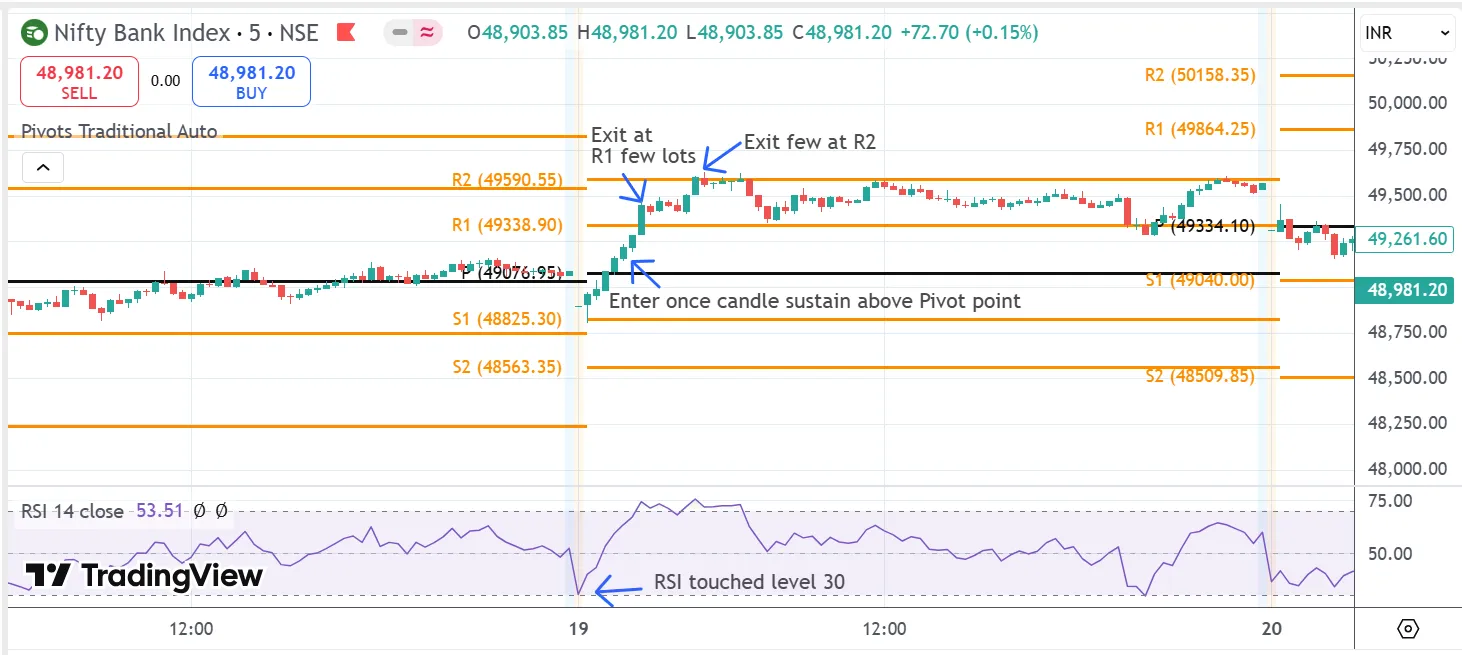
Setup 1: Pure Pivot Points Strategy
- Works best for: Stocks and indices
- Time Frame: 5-minute and 15-minute charts
- Indicators Used: Pivot Point Standard
How it works:
If the price opens above the pivot point (P), the market is bullish—look for buying opportunities at support levels.
If the price opens below the pivot point, the market is bearish—look for selling opportunities at resistance levels.
If the price breaks S1, the next target is S2 and then S3.
If the price breaks R1, the next target is R2 and then R3.


Setup 2: Pivot Points + MACD for Trend Confirmation
- Works best for: Stocks and indices
- Time Frame: 5-minute and 15-minute charts
- Indicators Used: Pivot Point Standard + MACD
How it works:
When the price touches a pivot level, check the MACD indicator.
If MACD shows a bullish crossover (signal line crossing above MACD line) at support, it confirms a buy trade.
If MACD shows a bearish crossover at resistance, it confirms a sell trade.
Combine this with pivot point breakouts for higher accuracy.


Setup 3: Pivot Points + RSI for Overbought/Oversold Signals
When using pivot points with RSI on smaller time frames, keep in mind that overbought and oversold levels within a trend can signal potential reversals. These reversals often indicate a temporary pullback, creating opportunities to capture smaller gains.
- Works best for: Stocks and indices
- Time Frame: 5-minute and 15-minute charts
- Indicators Used: Pivot Point Standard + RSI
How it works:
When the price reaches a pivot level, check RSI.
If RSI is below 30 at a support level, it signals a potential bounce (It signals buy opportunity).
If RSI is above 70 at a resistance level, it signals a potential reversal (It signals sell opportunity).
Combine RSI signals with pivot point breakouts and price action for better confirmation.


Conclusion
Pivot points are similar to a GPS for traders. They give you the important support and resistance levels, making it simpler to set targets, stop-losses, and handle risk. When you use pivot points along with MACD or RSI, you can enhance your trade accuracy and minimize false signals. The trick is not to dependent solely on pivot points; always search for confirmation using price action, volume, and other indicators.
Want to up your trading game? Begin to incorporate pivot points in your strategy today, play around with varying configurations, and monitor your progress.
Written by Suchitra
01st Mar 2025 / 5 Mins Read
Featured Posts

By Asma Torgal
8th July 2024
Stock Market Sentiment Drives Trading Decisions

By Tejaswi P
30th Aug 2024
Can Government Employees Do Trading in the Stock Market?
_11zon.webp?alt=media&token=bd974821-aee4-43a5-b467-01d1a67a570b)
By Suchitra
29th Mar 2025
Algo Trading in India Tech-Driven Strategies for Modern Investors
_20_11zon.webp?alt=media&token=6659b2e6-927e-42de-8375-e227e579f556)
By Asma Torgal
28th Mar 2025
Trading Across Time Zones, The Global Market Timings in IST
By
Fri Mar 21 2025
How to Use Parallel Channels, Trends & Patterns
_11zon.webp?alt=media&token=a8f3f55c-dc70-4d42-844e-6874ceff69ce)
By Suchitra
20th Mar 2025
Swing and Positional Trading with Pivot Points
_11zon.webp?alt=media&token=a05d2324-cace-44ed-a35f-50f9e63be9c3)
By Suchitra
13th Mar 2025
How Central Banks Influence Indian Stock Market Trends
_11zon.webp?alt=media&token=14cd8f87-8add-49ce-84f1-ca07a0c52b0c)
By Suchitra
12th Mar 2025
Two Essential Candlestick Patterns for Market Timing

By Suchitra
05th Mar 2025
How Algorithmic trading revolutionizes modern markets with efficiency and speed
By Asma Torgal
24th Sep 2024
Lot Size in Futures & Options Trading