
The Power of Volume Candlestick Patterns in Technical Analysis
In trading, price is often considered the ultimate truth. But seasoned traders know that price, without volume, tells only half the story. Volume reveals the strength behind a price move — whether it is backed by real interest or is just a temporary fluctuation. That is where volume candlesticks come in.
Unlike traditional candlestick charts, which focus only on price, volume candlesticks incorporate trading volume into the size or appearance of each candle. They offer a powerful tool to gauge market sentiment and identify high-probability setups.
What are volume candlesticks?
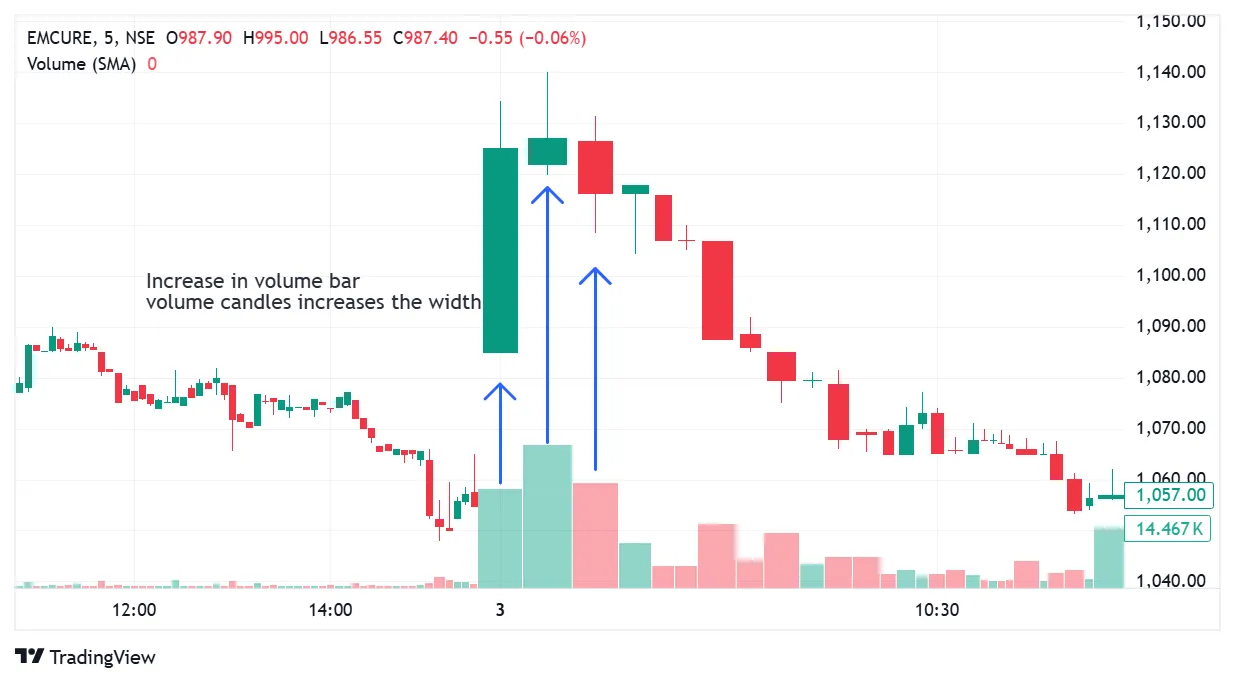
Volume candlesticks display price action (open, high, low, close) along with the trading volume. Typically, the width or color intensity of the candlestick changes based on volume. Wider or darker candles indicate higher volume, while thinner or lighter ones indicate lower volume than the wider candles.
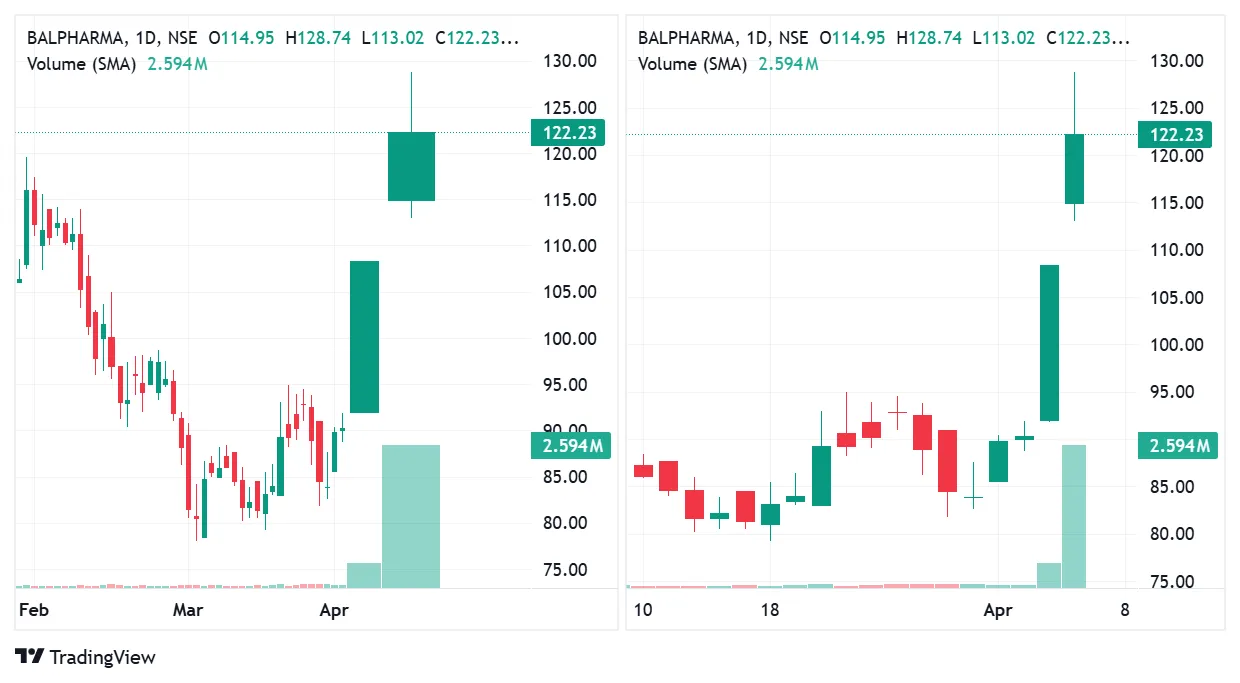
Volume candlesticks are derived from volume bars, integrating both price and volume data into a single representation. They provide a clearer picture of where demand is building up and where supply is increasing in the market. This combined view simplifies analysis by clearly illustrating how trading activity influences price action, as seen in the chart below, where volume is effectively pulled from the volume bars.
On April 3rd and 4th, 2025, BalPharma stock witnessed a notable increase in trading volume, as is evident in the provided chart. Comparing the standard candlestick chart with the volume candlestick chart highlights how volume-based visualization offers a clearer picture of trading activity. The surge in volume suggests heightened investor interest, indicating accumulation or increased market participation.
Why are volume candlesticks important?
Volume is often referred to as the fuel behind price. When combined with candlestick patterns, trading volume indicators helps to:
-
Confirm breakouts or breakdowns
-
Distinguish between real and false reversals
-
Gauge buying/selling pressure during consolidations
-
Identify exhaustion or continuation patterns
For example, a breakout that occurs on high volume is more likely to sustain than one on low volume, which might be a false signal or a trap.
Without volume confirmation, many candlestick patterns may fail to hold significance, making it essential to track trading activity alongside price movements.
Popular Volume Candlestick Patterns to Watch with volume based trading strategies
1. Shooting Star
These single-candle reversal patterns have long wicks and small bodies.
Volume signal:
A shooting star with high volume at the top may indicate strong selling pressure and a potential reversal.
How to trade the shooting star pattern
Confirmation is Crucial
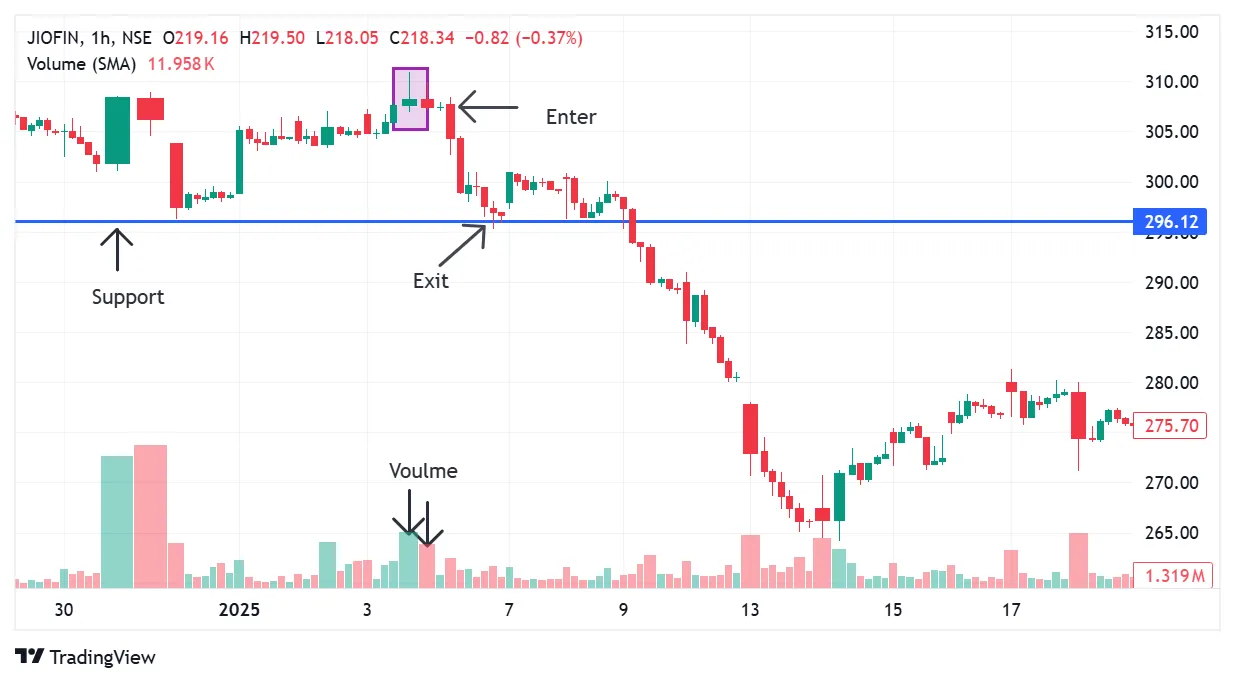
On the chart of Jio Financial (3rd January 2025), a shooting star pattern appeared after an upward move, indicating a potential bearish reversal. Volume also showed signs of build-up, strengthening the validity of the pattern. Wait for the next candle to close below the low of the shooting star to confirm bearish momentum.
Entry Point
An entry was triggered at ₹307, marking a break below the low of the shooting star pattern. This confirmed the bearish reversal signal and initiated the sell trade.
Set Your Stop-Loss
To protect against false signals, a stop-loss was placed just above the high of the shooting star, at ₹310.
Exit Strategy
The nearest support level was identified at ₹296, which was eventually reached, triggering an exit from the trade.
Traders may opt to book partial profits at this level and trail the stop-loss on the remaining position. This approach helps maximize potential gains while effectively managing risk
2. Bearish Abandoned Baby
The bearish abandoned baby is a rare but powerful reversal pattern characterised by a gap between candles. It typically signals a strong shift in market sentiment from bullish to bearish.
Volume Signal
If the final candle forms on high volume, it significantly strengthens the reversal signal, especially when it coincides with a key support or resistance level.
How to trade the abandoned baby bearish pattern
Confirmation is Crucial
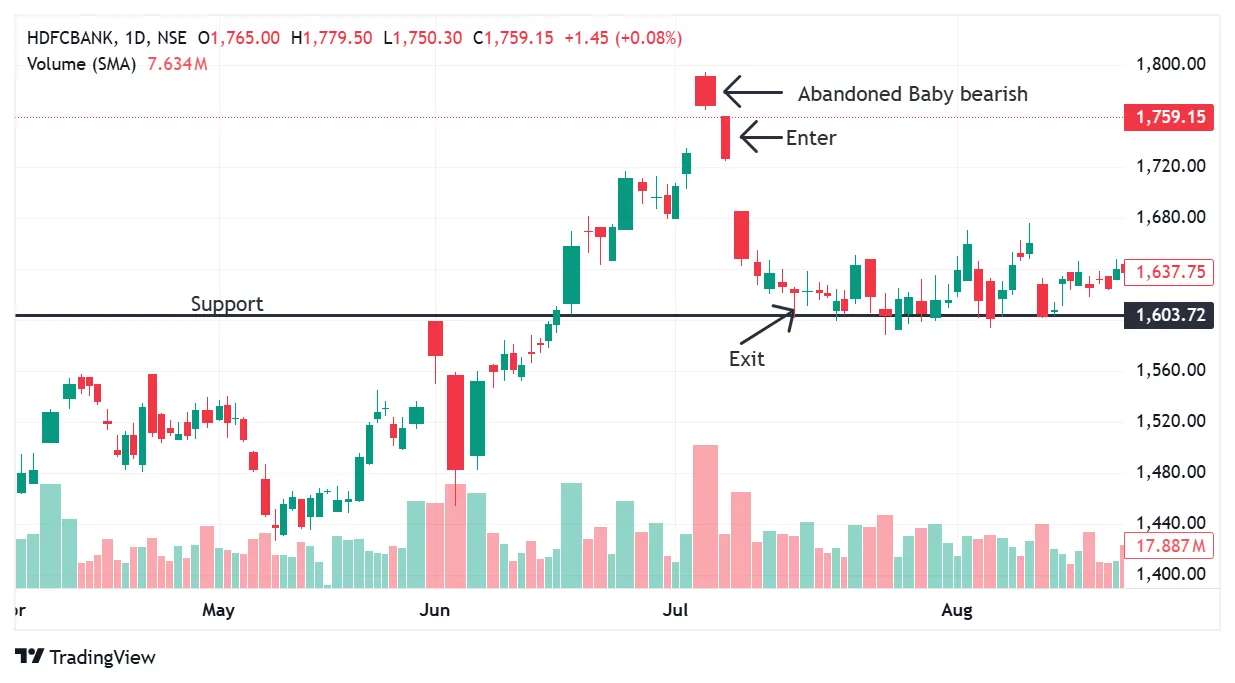
On HDFC Bank’s chart (3rd July 2024), a Bearish Abandoned Baby pattern formed following a strong upward move, indicating a potential trend reversal. The price gapped up but failed to sustain the momentum. The subsequent candle closed lower, confirming the bearish shift and validating the reversal signal.
Entry Point
A short position was initiated at ₹1760, marking the breakdown level following the completion of the Bearish Abandoned Baby pattern. This confirmed the reversal signal and triggered the trade entry.
Set Your Stop-Loss
To protect against potential false breakdowns, a stop-loss was placed just above the high of the pattern, at ₹1793.
Exit Strategy
The nearest support level was identified at ₹1603, based on a previous swing low. This level served as the profit target and was eventually reached, triggering an exit from the trade. Traders may consider booking partial profits at such key levels while trailing the stop-loss on the remaining position. This approach allows for capturing further downside potential while managing risk, as price often reacts or reverses near strong support or resistance zones.
3. Tweezer Top and Bottom
Tweezer Top and Tweezer Bottom are two-candle reversal patterns that form when the price attempts to continue in one direction but fails, indicating a potential shift in trend. These patterns often appear near key support or resistance levels.
Volume Signal
Reversal confirmation is stronger when the second candle in the tweezer pattern forms on higher volume. This suggests increasing conviction among traders and signals a potential change in market sentiment.
How to trade the tweezer top pattern
Confirmation is Crucial
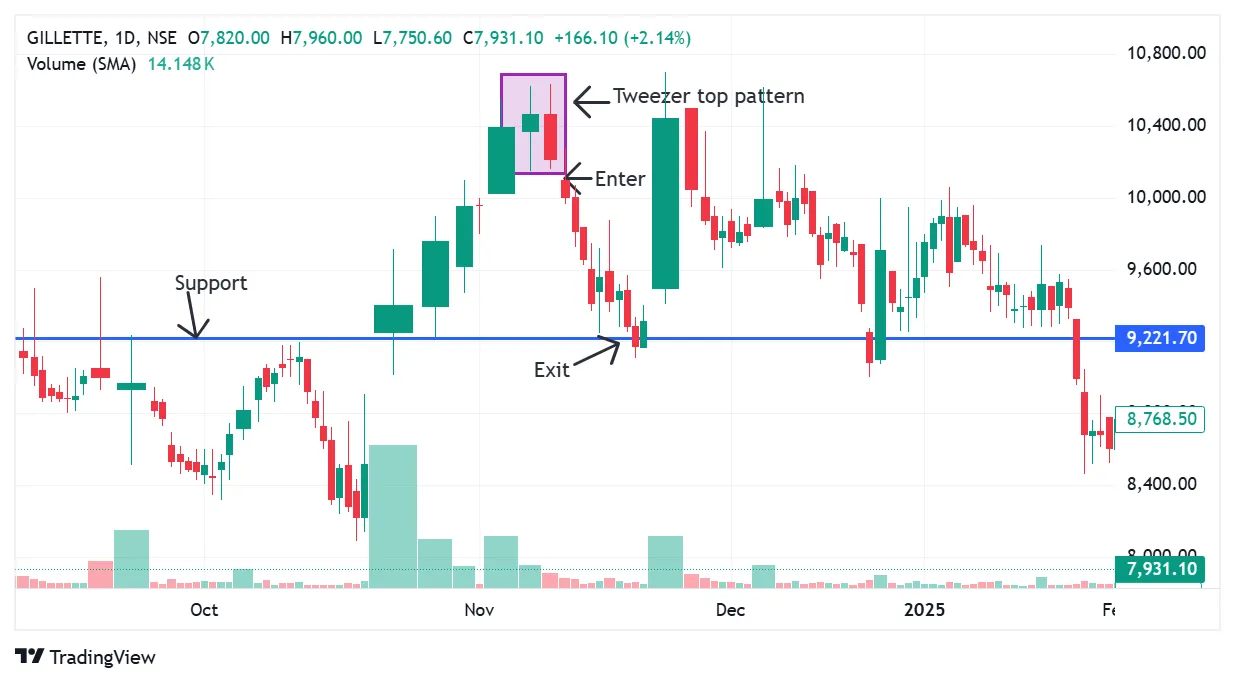
On the Gillette chart (5th November 2024), a Tweezer Top pattern formed after a sustained upward move, accompanied by high volume. This signalled a potential bearish reversal. Confirmation came as the price broke below the low of the Tweezer Top formation, indicating weakening bullish momentum.
Entry Point
A short position was initiated at ₹10,107 when the price broke below the low of the Tweezer Top, confirming the bearish setup and triggering the entry.
Set Your Stop-Loss
To guard against potential false signals, a stop-loss was placed just above the high of the Tweezer Top, at ₹10,625.
Exit Strategy
The previous swing low at ₹9,221 was identified as a key support level and set as the target for the trade. The price eventually reached this level, triggering an exit.
Traders may consider booking partial profits near such strong support zones while trailing the stop-loss on the remaining position. This helps manage risk and lock in additional gains if the downward momentum continues.
5. Bearish Engulfing
The bearish engulfing pattern signals a strong shift in momentum, where the bearish candle completely engulfs the previous bullish candle. It typically forms at the end of an uptrend and suggests a potential reversal to the downside.
Volume Signal
If the engulfing candle forms on significantly higher volume, it strengthens the pattern’s reliability. This can indicate institutional selling or a decisive shift in trader sentiment, further confirming the potential for a bearish reversal.
How to Trade the Bearish Engulfing Pattern
Confirmation is Crucial
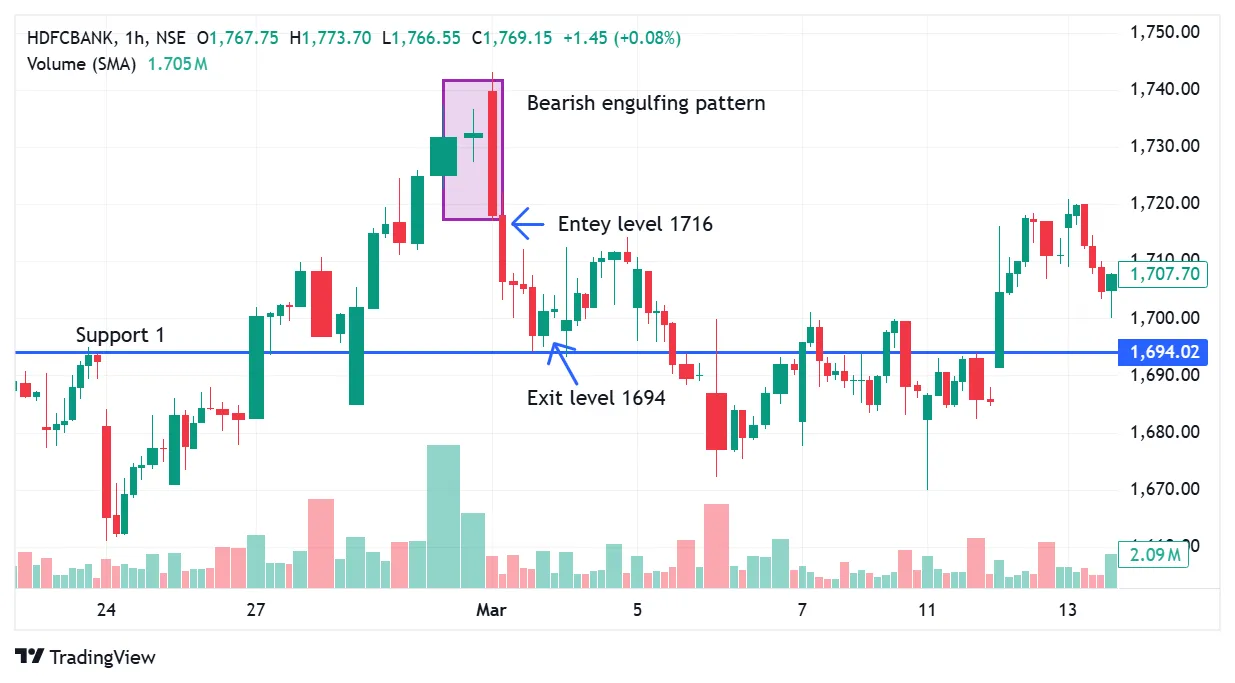
On the chart of HDFC bank (28th February 2025), a Bearish Engulfing pattern appeared after a prior uptrend, supported by a volume spike. This pattern indicated a potential bearish reversal. The confirmation came as the price broke below the low of the engulfing candle, signalling strong selling pressure.
Entry Point
A short position was initiated at ₹1,716 when the price broke below the low of the Bearish Engulfing pattern. This confirmed the reversal and triggered the entry.
Set Your Stop-Loss
To safeguard against any false moves, a stop-loss was placed just above the high of the engulfing candle at ₹1,740.
Exit Strategy
The nearest support zone was identified at ₹1,694, based on a previous swing low. This acted as the primary target and was later hit, triggering a partial exit.
Traders may choose to book some profits at this level and trail the stop-loss on the remaining quantity until the next support level is tested, helping to manage risk while capturing further downside.
6. Bullish Engulfing
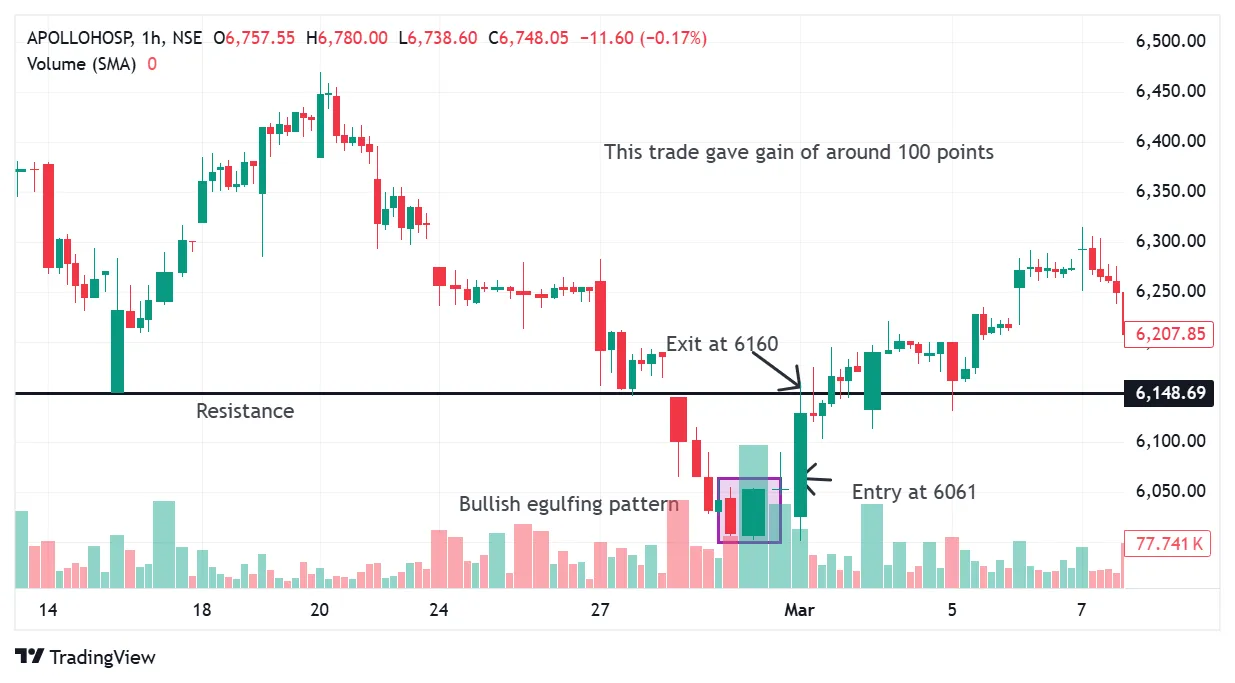
The bullish engulfing pattern indicates a strong reversal in momentum, where a bullish candle completely engulfs the previous bearish candle. Typically found at the end of a downtrend, this pattern suggests a potential shift to the upside.
Volume Signal
If the engulfing candle forms on significantly higher volume, it adds credibility to the pattern. This may signal institutional buying or a decisive change in trader sentiment, increasing the likelihood of a bullish reversal.
Combining volume with indicators for better results
Moving Averages (10 and 20 SMA)
Pullbacks to the 10-period or 20-period simple moving average (SMA) on low volume can present excellent entry opportunities. If the price bounces off the moving average with increasing volume, it confirms that the level is acting as support. Either of the SMAs can be used for this strategy, though in the example below, the 20-period SMA is utilized.
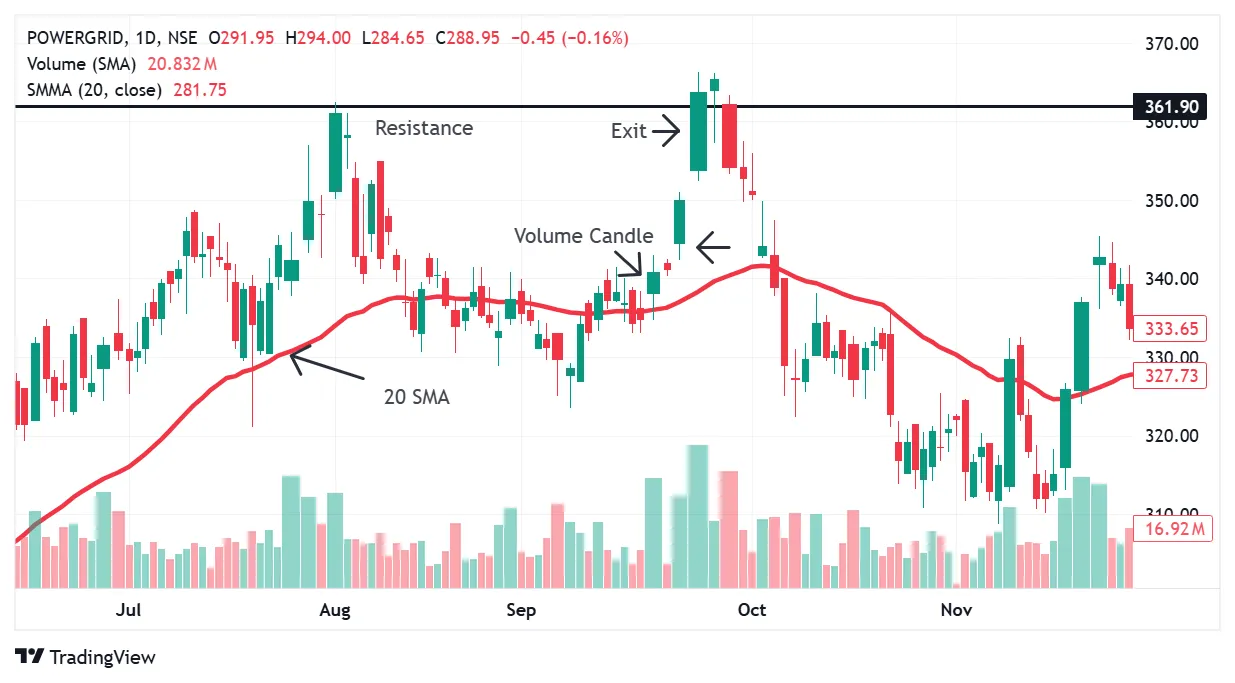
How to trade a high-volume breakout with 20 SMA as Support
Confirmation is Crucial
On the chart of Power Grid (20th November 2024), a significant volume spike occurred with the candle closing above the 20-day SMA. This signaled strong buying interest and a potential breakout. The breakout was confirmed once the price moved above the high of the volume candle, indicating sustained bullish momentum.
Entry Point
A long position was triggered at ₹344 when the price broke above the high of the volume candle. This confirmed the bullish setup and initiated the entry.
Set Your Stop-Loss
To manage risk, a stop-loss was placed just below the 20-day SMA. A close below this level would signal a failure of the breakout and trigger an exit.
Exit Strategy
The nearest resistance level, based on a previous swing high, was identified at ₹362. This level was eventually tested, prompting an exit from the trade.
Traders may consider booking partial profits at such resistance levels while trailing the stop-loss on the remaining position. This approach helps manage risk and lock in gains, as price often reacts or reverses near key resistance zones.
Avoiding common mistakes with volume candlesticks
1. Overlooking Context
Volume patterns need to be interpreted in the broader context of trend direction, support/resistance levels, and market sentiment.
2. Misreading Volume Spikes
High volume does not always mean accumulation. It could also indicate distribution. Always look at price behaviour in parallel.
3. Trading Illiquid Stocks
Volume candlesticks are more effective on liquid stocks. In thinly traded counters, volume spikes may be misleading.
4. Using Only One Timeframe
Volume behaviour can vary across timeframes. Always validate signals on multiple timeframes before acting.
5. Expecting Perfect Setups
Not every textbook pattern will work out. Use volume as a confirmation tool, not a standalone signal.
Key tool for Indian traders
Volume candlesticks add an extra layer of insight that price action alone cannot provide. They help traders distinguish real moves from false signals, and when used correctly, they can significantly improve trade selection and timing.
For Indian traders navigating volatile intraday and swing markets, volume analysis offers a reliable compass. When price and volume speak the same language, the message is often clearer.
As always, practice and backtesting are key. Observe how volume reacts at key levels, during breakouts, and around reversal setups. With time, this becomes a powerful addition to your trading toolkit.
Written by Suchitra
17th Apr 2025 / 10 Mins Read
Featured Posts

By Asma Torgal
8th July 2024
Stock Market Sentiment Drives Trading Decisions

By Tejaswi P
30th Aug 2024
Can Government Employees Do Trading in the Stock Market?
_11zon.webp?alt=media&token=bd974821-aee4-43a5-b467-01d1a67a570b)
By Suchitra
29th Mar 2025
Algo Trading in India Tech-Driven Strategies for Modern Investors
_20_11zon.webp?alt=media&token=6659b2e6-927e-42de-8375-e227e579f556)
By Asma Torgal
28th Mar 2025
Trading Across Time Zones, The Global Market Timings in IST
By
Fri Mar 21 2025
How to Use Parallel Channels, Trends & Patterns
_11zon.webp?alt=media&token=a8f3f55c-dc70-4d42-844e-6874ceff69ce)
By Suchitra
20th Mar 2025
Swing and Positional Trading with Pivot Points
_11zon.webp?alt=media&token=a05d2324-cace-44ed-a35f-50f9e63be9c3)
By Suchitra
13th Mar 2025
How Central Banks Influence Indian Stock Market Trends
_11zon.webp?alt=media&token=14cd8f87-8add-49ce-84f1-ca07a0c52b0c)
By Suchitra
12th Mar 2025
Two Essential Candlestick Patterns for Market Timing

By Suchitra
05th Mar 2025
How Algorithmic trading revolutionizes modern markets with efficiency and speed
By Asma Torgal
24th Sep 2024
Lot Size in Futures & Options Trading
_15_11zon.webp?alt=media&token=6e728422-56ca-4a66-8564-3bcd050f7b6d)

