Types of Pivot Points used for Trading
.webp?alt=media&token=d5ca20b8-c52a-4bb8-9e71-556aa1afa15c)
Pivot points help traders identify key price levels for potential market reversals. This guide covers Standard, Fibonacci, Woodie’s, and Camarilla pivot points, explaining how they work, when to use them, and common mistakes to avoid.
If you have dipped your toes into trading, chances are you have heard of pivot points. Think of them as your market GPS—they help map out key price levels where the market might bounce or break. But with so many types out there, it can get a little confusing.
In this article, we are delve into the into the topic of pivot points those little markers that help traders figure out potential turning points in the market. You will understand exactly what pivot points are and why they are so go-to for so many traders. We are going to break down the various types, such as Standard, Fibonacci, Woodie's, and Camarilla so you are aware of how each one operates. Morever, we will dicuss about when and how to use these pivot points in your trades to enable you to make better decisions.
Lets us look into different types of pivot points indicator.
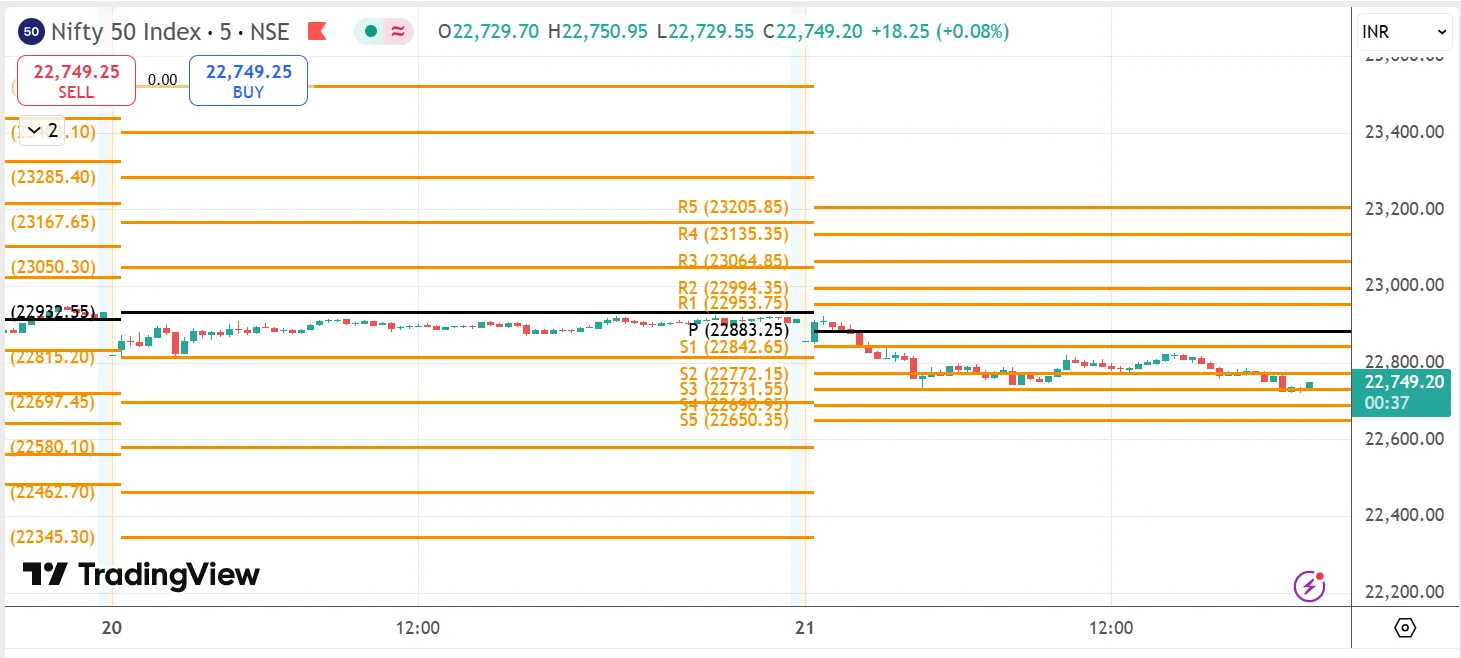
1. Standard Pivot Points
Standard pivot points help you spot key price levels in the market for the next trading day. They're pretty straightforward - you take yesterday's highest price, lowest price, and closing price, do some quick math, and get a set of levels.
The main pivot point acts like a baseline. Above it, you get three resistance levels where prices might stop rising. Below it, there are three support levels where prices might stop falling (3 Resistence+3 + 3 support + 1 Pivot point) .
Traders keep an eye on these levels because they can show where big moves might start or stop. Sure, prices don't always follow these levels exactly, but they're helpful guides, especially when lots of traders are watching the same points.
It's really just a practical way to map out your trading day. Nothing fancy or complicated - just a time-tested tool that still works well in today's markets.
Pivot (P) = (High + Low + Close) ÷ 3
Once you have the central pivot, you get support and resistance levels:
R1 (Resistance 1) = (2 × P) – Low
S1 (Support 1) = (2 × P) – High
If you wish for more detail, you can extend these to R2, R3, S2, S3, and so on. But most traders stick to the first couple of levels.
When to Use:
These are great for day traders or swing traders who want to quickly identify support and resistance zones. Prices tend to hover around these levels before making a move.
Real-World Tip:
When the market is moving sideways or is range-bound, standard pivot points can be your best friend. If you see the price getting stuck at the pivot level, watch closely—it could either break out or bounce back.
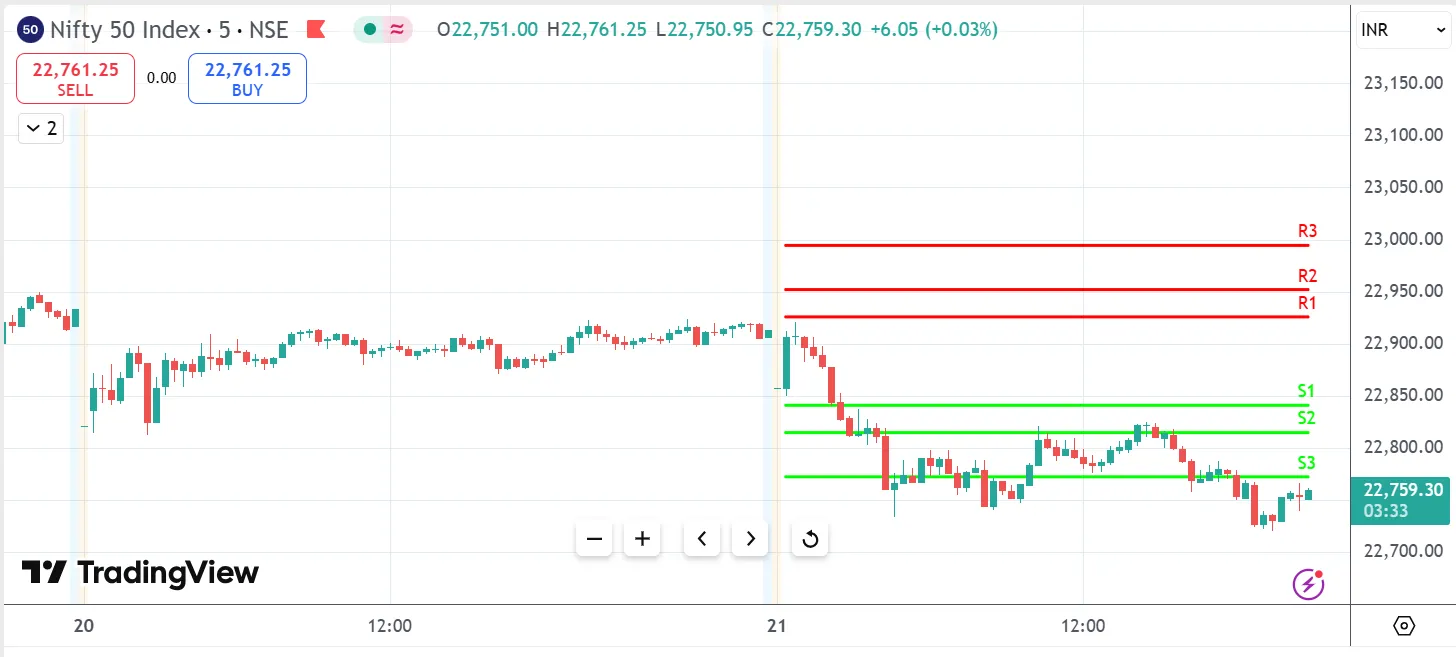
2. Fibonacci Pivot Points
Fibonacci pivot points take the basic pivot idea and make it a bit more interesting. While they still use a central pivot point like the regular method, they tap into those special Fibonacci numbers you might have heard traders talk about.
Instead of evenly spacing out the support and resistance levels, these pivots use special ratios - 38.2%, 61.8%, and 100%. These ratios come from math patterns and many traders have adopted it. Like standard pivots, they help map out the next day's trading levels, just with a different way of spacing them out.
R1 = P + (0.382 × Range)
S1 = P – (0.382 × Range)
When to Use:
If the market is trending, Fibonacci pivot points can help spot potential pullbacks before the trend resumes.
Real-World Tip:
Combine these with trendlines or moving averages for stronger signals. If multiple indicators align at the same level, it could be a great spot to enter or exit a trade.
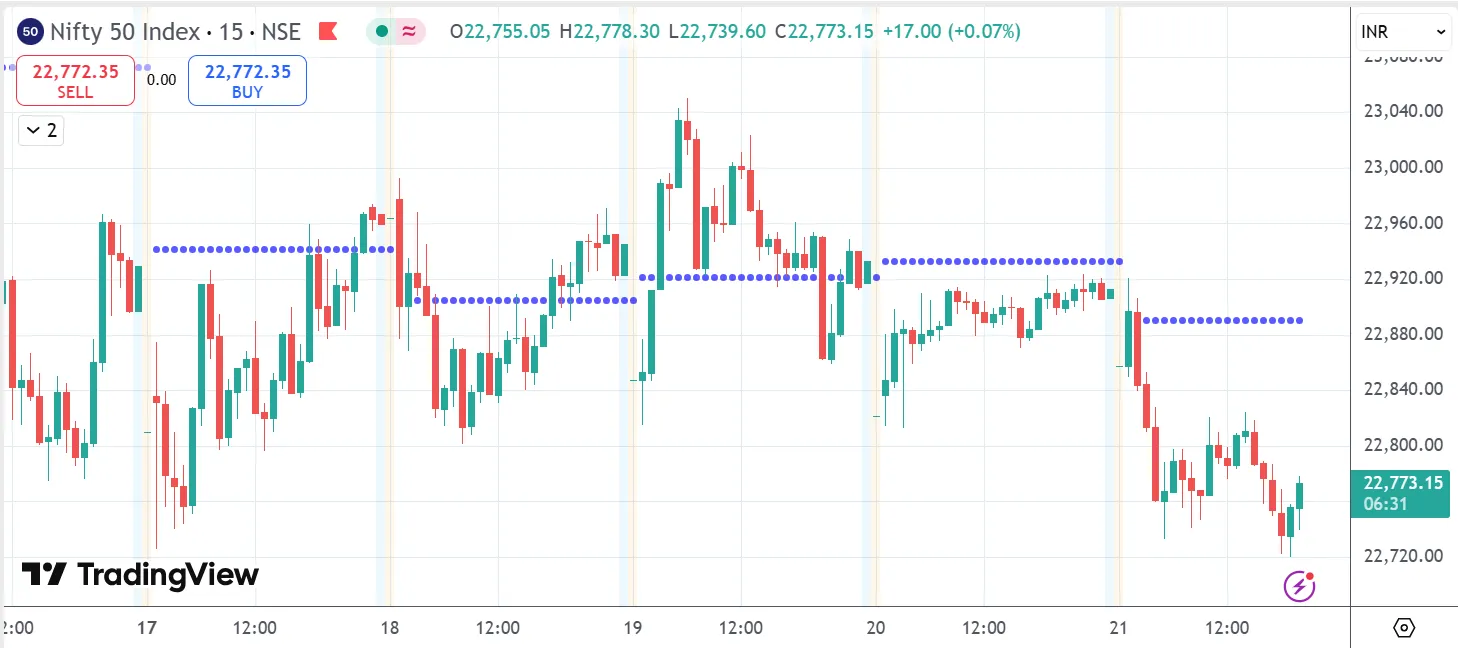
3. Woodie’s Pivot Points
Things are somewhat shaken up by Woodie's pivot points. They give greater weight to today's opening price rather than yesterday's closing price. Although the math is a little different, the concept remains the same: identifying potential price turning points. Some traders prefer Woodie's because they say it better reflects how today's trading might go, especially since it factors in the fresh start of a new day.
P = (High + Low + 2 × Open) ÷ 4
When to Use:
These work well if you are trading fast-moving markets or news events. They react quicker to new information than standard pivot points.
Real-World Tip:
If you are trading during high-volatility periods, Woodie’s pivot points can give you an edge in staying ahead of the market moves.
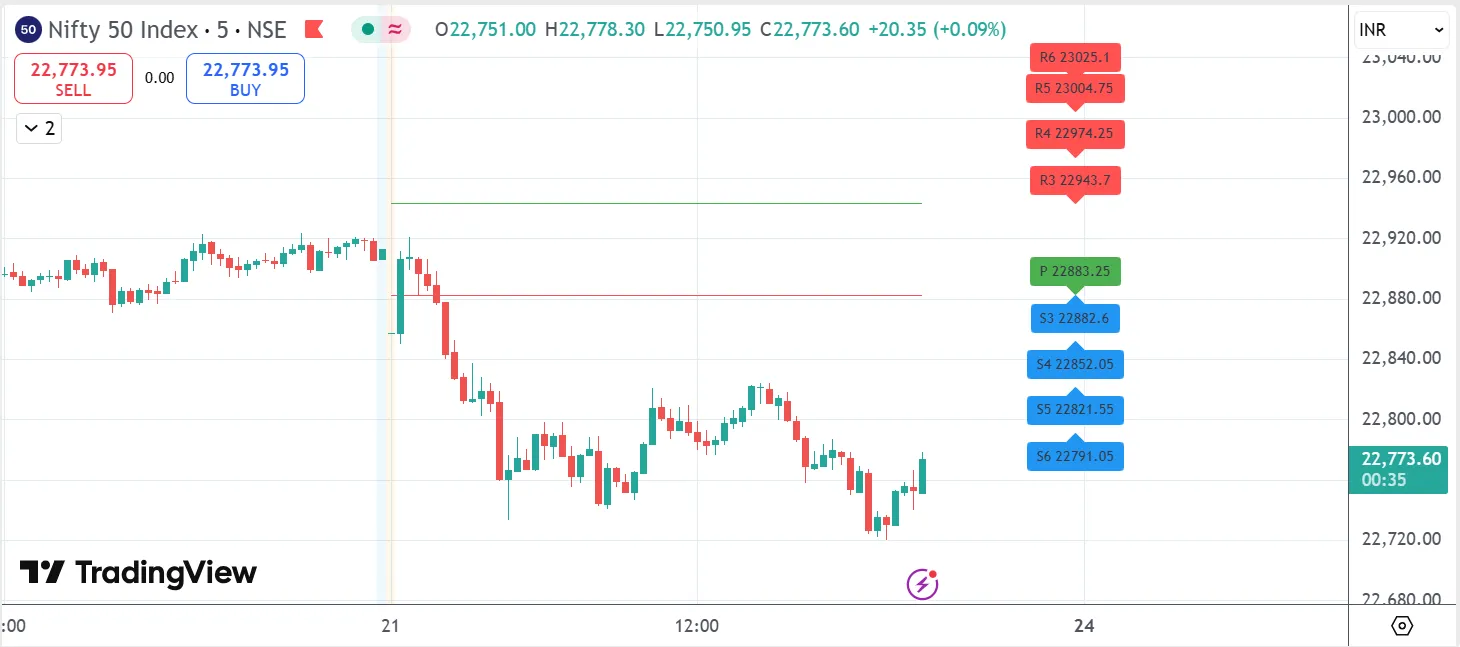
4. Camarilla Pivot Points
Camarilla Pivot Points Camarilla pivots get more specific with their levels - they give you eight potential turning points (four above, four below). They are especially popular with day traders because they tend to give tighter, more precise levels. The math looks scarier, but don't let that fool you - they are just another way to map out where prices might pause or reverse.
R3 and S3: Watch for bounces here.
R4 and S4: These are breakout levels—pay close attention.
When to Use:
If you are looking for intraday reversals or breakouts, Camarilla levels can help you spot where the price might change direction.
Real-World Tip:
Keep a close eye on R3 and S3. If the price bounces off these levels, it is often a sign of a strong reversal.
Common Mistakes to Avoid:
-
Too Many Levels: Avoid using too many pivot levels. Too much information can lead to 'analysis paralysis.' Focus on the key levels that which is most important.
-
Volatile Markets: Pivot points can get noisy in choppy or highly volatile markets if mostly used on smaller timeframes. Always cross-check with other indicators before making decisions.
-
False Signals: They can be overly sensitive, especially in sideways markets. Be cautious and use them as part of a broader strategy.
Conclusion
For confident trading decisions, combine pivot points with other indicators. Test different types to find what fits your style. Camarilla helps spot reversals, Woodie’s offers quick market responses, Fibonacci is ideal for trend traders, and standard pivot points are simple and reliable. Pivot points are not one-size-fits-all!
Disclaimer: This article is for educational purposes only and does not constitute financial advice. Please consult a certified financial advisor before making any investment decisions
Written by Suchitra
25th Feb 2025 / 5 Mins Read
Featured Posts

By Asma Torgal
8th July 2024
Stock Market Sentiment Drives Trading Decisions

By Tejaswi P
30th Aug 2024
Can Government Employees Do Trading in the Stock Market?
_11zon.webp?alt=media&token=bd974821-aee4-43a5-b467-01d1a67a570b)
By Suchitra
29th Mar 2025
Algo Trading in India Tech-Driven Strategies for Modern Investors
_20_11zon.webp?alt=media&token=6659b2e6-927e-42de-8375-e227e579f556)
By Asma Torgal
28th Mar 2025
Trading Across Time Zones, The Global Market Timings in IST
By
Fri Mar 21 2025
How to Use Parallel Channels, Trends & Patterns
_11zon.webp?alt=media&token=a8f3f55c-dc70-4d42-844e-6874ceff69ce)
By Suchitra
20th Mar 2025
Swing and Positional Trading with Pivot Points
_11zon.webp?alt=media&token=a05d2324-cace-44ed-a35f-50f9e63be9c3)
By Suchitra
13th Mar 2025
How Central Banks Influence Indian Stock Market Trends
_11zon.webp?alt=media&token=14cd8f87-8add-49ce-84f1-ca07a0c52b0c)
By Suchitra
12th Mar 2025
Two Essential Candlestick Patterns for Market Timing

By Suchitra
05th Mar 2025
How Algorithmic trading revolutionizes modern markets with efficiency and speed
By Asma Torgal
24th Sep 2024
Lot Size in Futures & Options Trading