
What are Harmonic Patterns and Advanced Trend forecasting?
Harmonic patterns help traders decode market movements and identify potential reversals or trend continuations. This guide covers three key patterns—ABCD, XABCD, and Three Drives—explaining how to spot, draw, and use them effectively. By integrating these patterns with indicators like Fibonacci retracements, RSI, and MACD, traders can make more informed decisions. While no strategy guarantees success, testing these patterns on historical data and applying risk management can refine trading skills.
When it comes to trading, harmonic patterns can feel like hidden messages the market is trying to send, but sometimes all you hear is noise. These patterns—rooted in market psychology—might seem like complex puzzles at first, but they can be powerful tools for predicting where prices might head next. In this guide, we’ll explore three key harmonic patterns: the ABCD, the XABCD, and the Three Drives pattern, and show you how they can bring more clarity to your trading strategy.
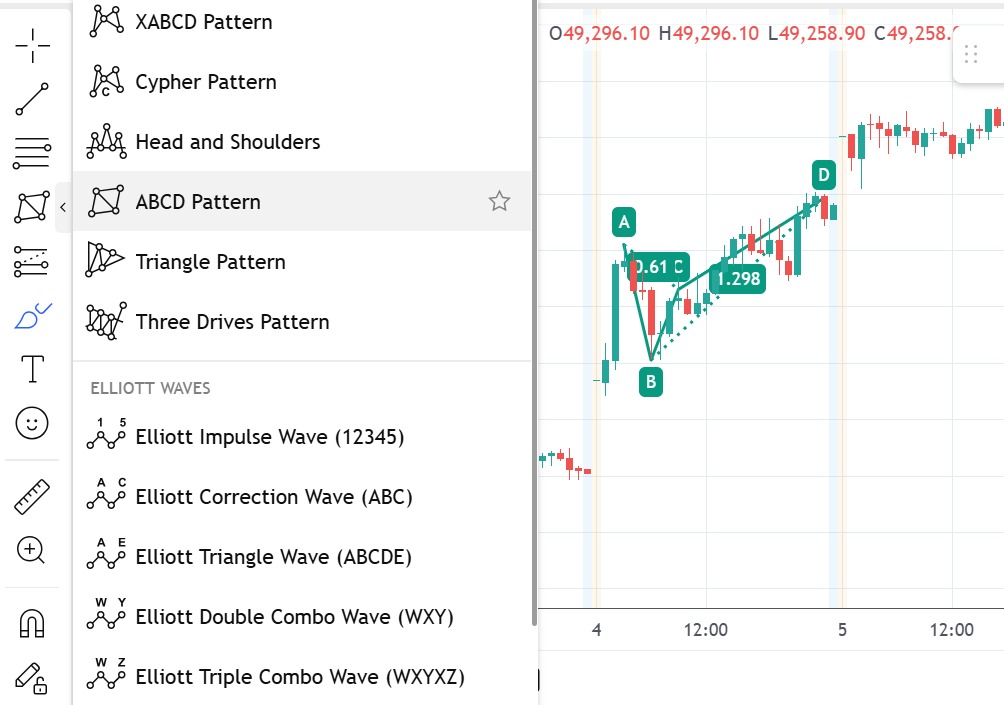
On your charting platform, you don’t have to figure out these patterns from scratch—standard tools like trend lines and Fibonacci retracements make it easy to plot them accurately. Simply select your tool, click on the chart to mark your starting point, and drag to where you see the pattern forming. This hands-on approach not only sharpens your analysis but also helps you visualize potential opportunities with confidence.
Throughout this article, you’ll learn how to spot these harmonic patterns, use drawing tools to map them out effectively, and understand what their formations might signal about market behaviour. By the end, you’ll have a practical toolkit to identify potential reversals and continuations, making your technical analysis more strategic and insightful as you navigate the markets.
1. Decoding the ABCD Pattern for Profitable Trades
Why is it Used?
The ABCD pattern is like the 'Hello, I’m here to help!' of harmonic patterns. It is one of the simplest structures that traders use to spot potential reversals. In essence, it gives you a clue that the current move might be coming to an end, offering an opportunity to get in on a reversal before the market swings again.
How It is Used
-
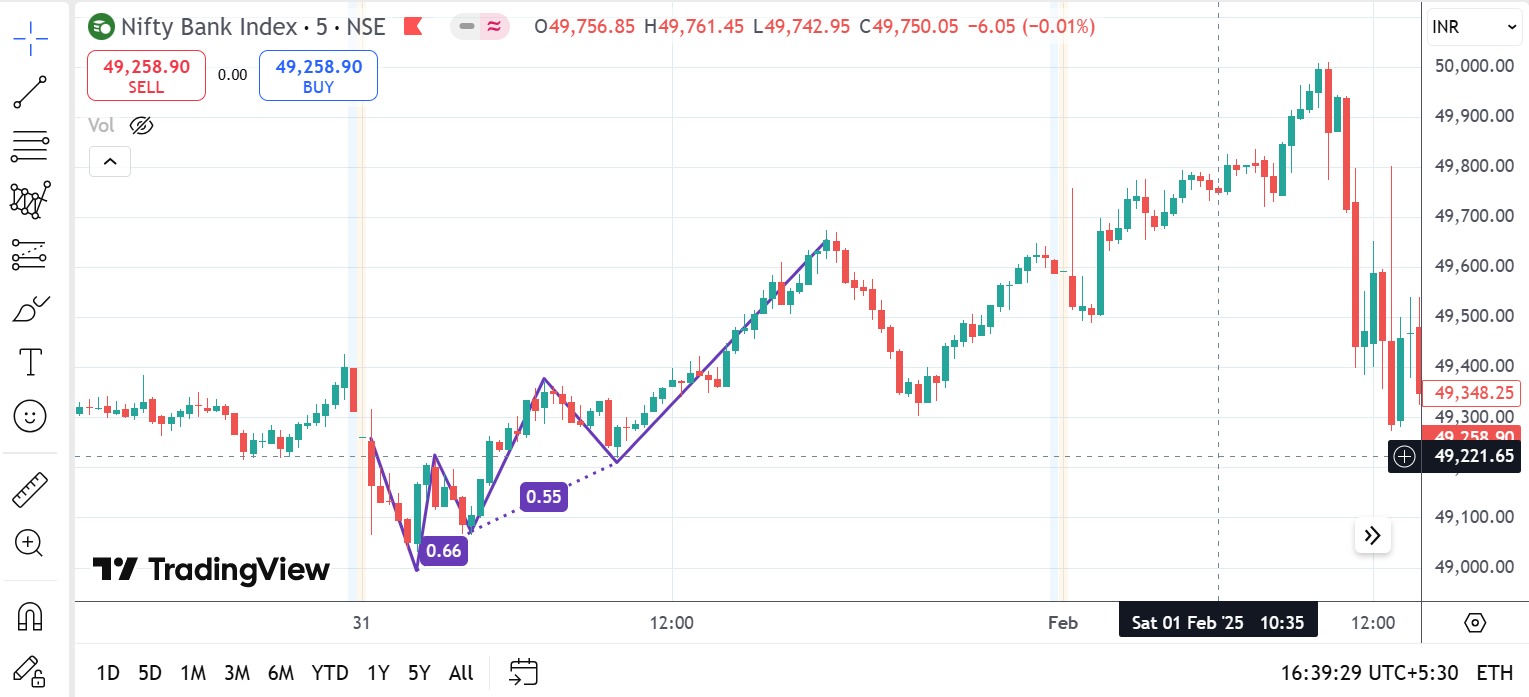
The Structure: Think of it as a journey—starting at point A, moving to B, retracing a bit to C, and finally finishing at D. The move from A to B is expected to mirror the move from C to D in terms of price projection.
-
Measurements: Traders typically measure these legs to ensure the distance from C to D is similar to that from A to B. That symmetry is what gives the pattern its predictive power.
-
Confirmation: Often, you’ll combine this with Fibonacci retracement levels or momentum indicators to confirm that a reversal is likely.
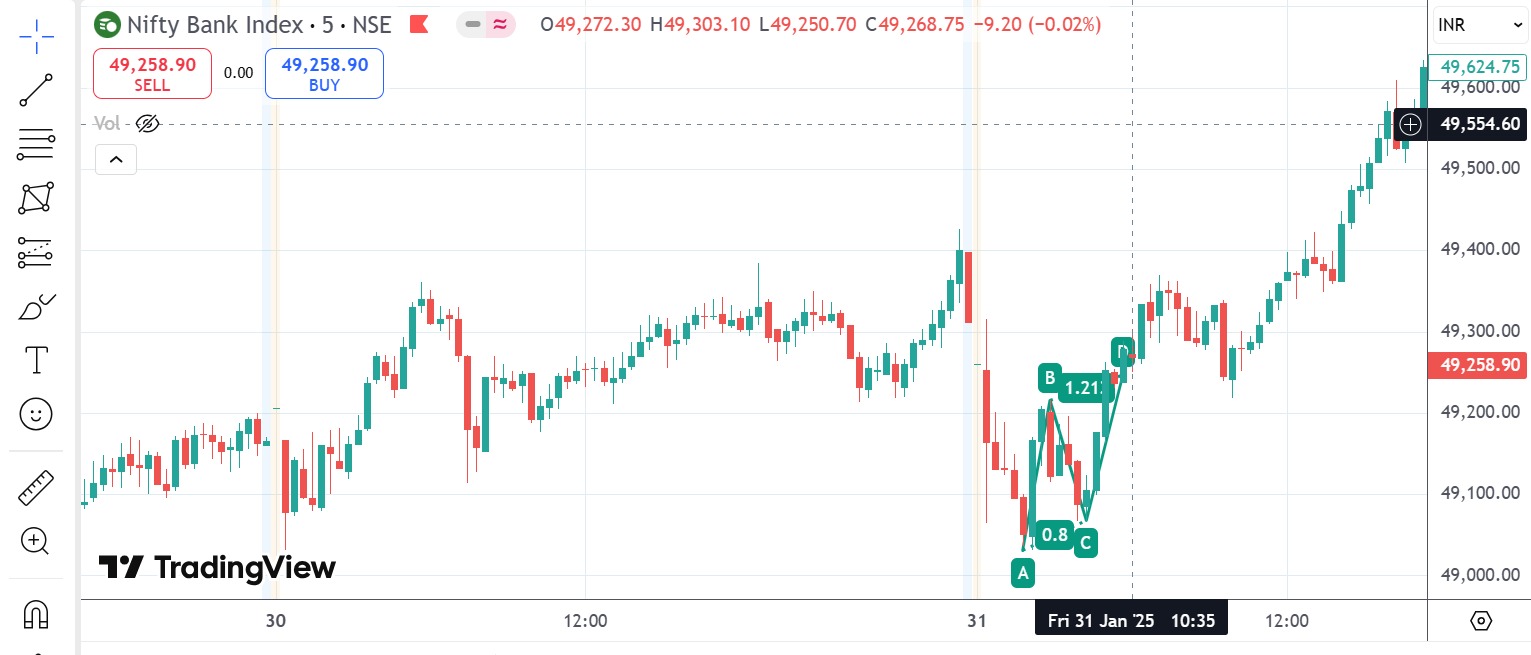
Steps to Draw the ABCD Pattern on Your Chart
- Identify Point A: Find the starting point where the trend correction begins.
- Mark Point B: Locate the extreme price point where the initial move peaks.
- Draw the A-B Leg: Use your trend line tool to connect A to B.
- Locate Point C: Look for a retracement from B that hints at a potential reversal and mark it.
- Project Point D: Using an estimate D so that the distance from C to D mirrors the A to B move.
- Draw the C-D Leg: Connect point C to your projected D.
- Double-Check: Use additional indicators (like RSI or MACD) to confirm that the reversal is forming.
When It is Used
Use the ABCD pattern during a correction in a trending market. It is like catching the market on a 'breather' before it resumes its climb—or decline. It works best when the market appears overextended and hints at a potential reversal.
2. Mastering the XABCD Pattern in Harmonic Trading
Why is it Used?
The XABCD pattern takes the basic ABCD and adds an extra twist—the initial 'X' leg. Think of it as upgrading your smartphone with more features, more flexibility, and potentially more profitable signals. This extra starting point gives you a broader perspective, capturing more complex market scenarios.
How It is Used
- The Extra Step: Begin at point X, setting the stage for the move to A, then follow with B, C, and finally D.
- Flexibility: The extra leg means this pattern can adapt to more market conditions, catching moves that the simpler ABCD might miss.
- Strategy Integration: Like its simpler cousin, you confirm this pattern with other indicators—it is not a ‘set’ it and forget it' tool.
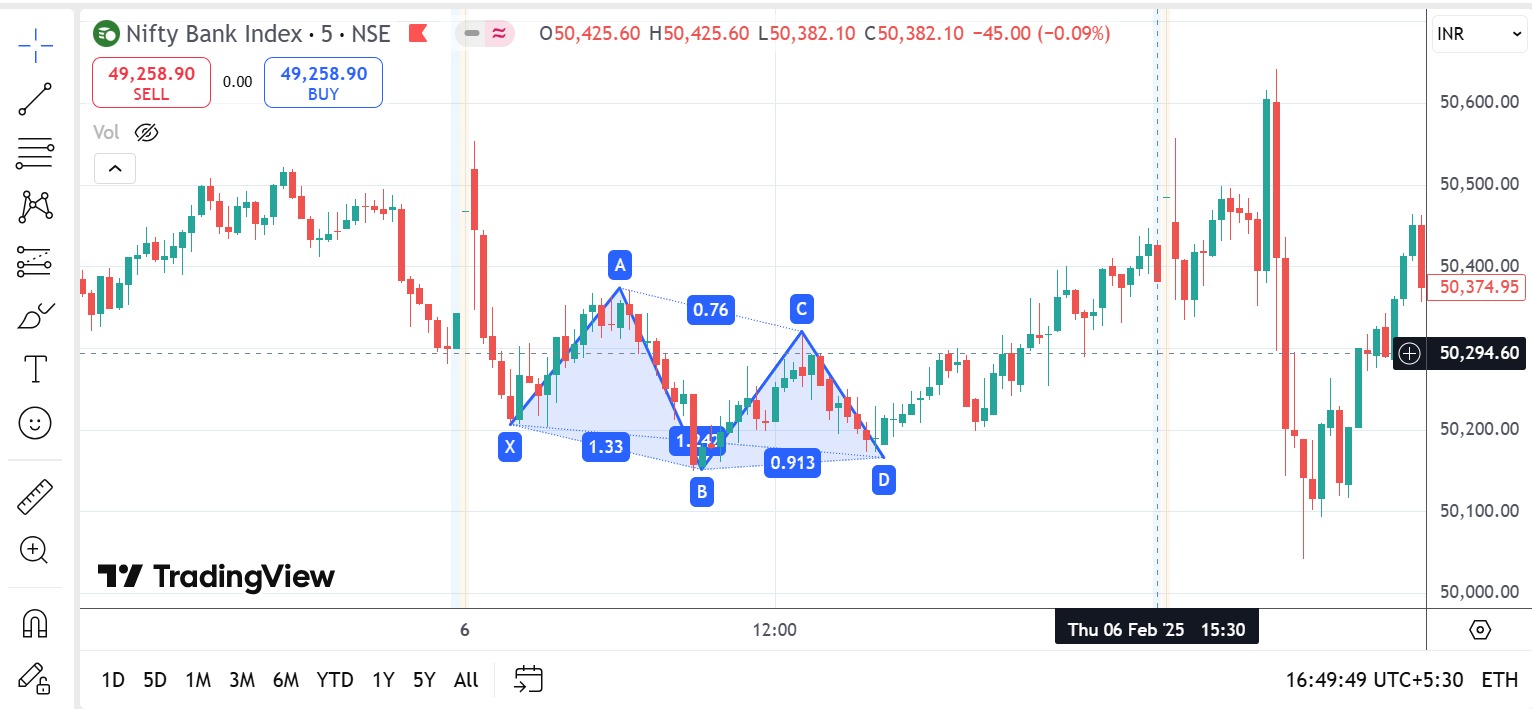
Steps to Draw the XABCD Pattern on Your Chart
- Identify Point X: Pinpoint, the beginning of the overall move that sets the context.
- Mark Point A: The move from X to A starts the pattern formation.
- Locate Point B: Find the extreme point following A, then mark it.
- Find Point C: Identify a retraction after B that hints at a potential reversal.
- Project Point D: Use Fibonacci or similar projection tools to set D so that the move from C to D reflects the move from A to B.
- Draw the Pattern: Connect X-A, A-B, B-C, and C-D with trend lines.
- Confirm: Cross-check with volume indicators or momentum tools to ensure the pattern is valid.
When is it used?
Deploy the XABCD pattern in markets with more nuanced or complex price movements. If the basic ABCD isn’t capturing all the action, it might be time to bring in the XABCD—especially in volatile or erratic conditions where extra context can guide your trading decisions.
3. The Three Drives Pattern: Spotting Trend Continuations
Why is it Used
While the ABCD and XABCD patterns focus on spotting reversals, the Three Drives pattern is all about confirming that a trend is here to stay. It is like that reliable friend who reminds you, 'Hey, the trend is still strong—stick with it'. This pattern suggests that the market is showing persistence, offering a signal that the current direction might continue with some vigor.
How is it used?
-
Three Consistent Drives: The pattern consists of three consecutive price moves (or 'drives') that are roughly equal in size, indicating a great trend.
-
The Setup: After the third drive, traders look for a retracement. If this pullback stays within a certain range, it confirms that the trend is intact.
-
Integration: As always, combine this with other indicators like volume or moving averages to avoid false signals.
Steps to Draw the Three Drives Pattern on Your Chart
- Identify the First Drive: Mark the start and end of the initial price move.
- Spot the Second Drive: Ensure the next price move is roughly equal in length to the first.
- Mark the Third Drive: Identify a third move that is again consistent with the previous two.
- Draw Trend Lines: Connect the endpoints of these drives to visualize the pattern.
- Look for Retraction: After the third drive, measure any retracement by spotting the length.
- Validate: Confirm that the retracement stays within the expected range to reinforce that the trend continuation is likely.
When is it used?
This pattern is best used during clear, trending markets where momentum is strong. It helps you decide whether to double down on a winning position or simply ride the trend a bit longer. It is your go-to signal when you need reassurance that the market’s current direction isn’t just a brief fluke.
Wrapping It All Up
Harmonic patterns like the ABCD, XABCD, and Three Drives offer traders a structured way to decode the market’s rhythm. They are not foolproof magic bullets, but when combined with other analysis tools, they can be powerful allies in your trading toolkit.
Skeptical Thought:
Sure, you might wonder, 'Do these patterns work, or am I just finding shapes in clouds?' And that’s a fair question! The key is to test these patterns on historical data, use proper risk management, and always combine them with additional indicators.
Trading is as much about learning and adaptation as it is about strategy. Even if you hit a few false signals along the way, each experience is a stepping stone toward refining your approach. So, keep experimenting, stay curious, and remember—every trader’s journey is paved with calculated moves and the occasional lucky break! Happy trading, and may your patterns always point you in the right direction!
Written by Anurag
04th Mar 2025 / 7 Mins Read
Featured Posts

By Asma Torgal
8th July 2024
Stock Market Sentiment Drives Trading Decisions

By Tejaswi P
30th Aug 2024
Can Government Employees Do Trading in the Stock Market?
_11zon.webp?alt=media&token=bd974821-aee4-43a5-b467-01d1a67a570b)
By Suchitra
29th Mar 2025
Algo Trading in India Tech-Driven Strategies for Modern Investors
_20_11zon.webp?alt=media&token=6659b2e6-927e-42de-8375-e227e579f556)
By Asma Torgal
28th Mar 2025
Trading Across Time Zones, The Global Market Timings in IST
By
Fri Mar 21 2025
How to Use Parallel Channels, Trends & Patterns
_11zon.webp?alt=media&token=a8f3f55c-dc70-4d42-844e-6874ceff69ce)
By Suchitra
20th Mar 2025
Swing and Positional Trading with Pivot Points
_11zon.webp?alt=media&token=a05d2324-cace-44ed-a35f-50f9e63be9c3)
By Suchitra
13th Mar 2025
How Central Banks Influence Indian Stock Market Trends
_11zon.webp?alt=media&token=14cd8f87-8add-49ce-84f1-ca07a0c52b0c)
By Suchitra
12th Mar 2025
Two Essential Candlestick Patterns for Market Timing

By Suchitra
05th Mar 2025
How Algorithmic trading revolutionizes modern markets with efficiency and speed

By Asma Torgal
24th Sep 2024
Lot Size in Futures & Options Trading

.webp?alt=media&token=51d6229c-fa81-4bf2-8a21-0ef89bc04ba2)