
What Are Trend Insights Moving Average Ribbon
_11zon.webp?alt=media&token=c88be1aa-d59e-428d-abdf-656f7cae1b2c)
The Moving Average Ribbon is a powerful tool for visualizing trends, identifying support and resistance levels, and confirming trade entries. By stacking multiple EMAs (such as 20, 50, 100, and 200), traders can gauge market strength and direction. The ribbon’s widening indicates strong trends, while contraction signals consolidation. This article explores practical strategies for intraday and swing trading using EMA crossovers, alignment setups, and dynamic support/resistance levels. While the Moving Average Ribbon is a valuable trend-following indicator, traders should combine it with proper risk management and backtesting for consistent success.
The Moving Average Ribbon is more than just a set of moving averages on your chart it is a dynamic tool that helps you visualize trends and spot potential trading opportunities with clarity. Let us break it down in a straightforward, conversational way.
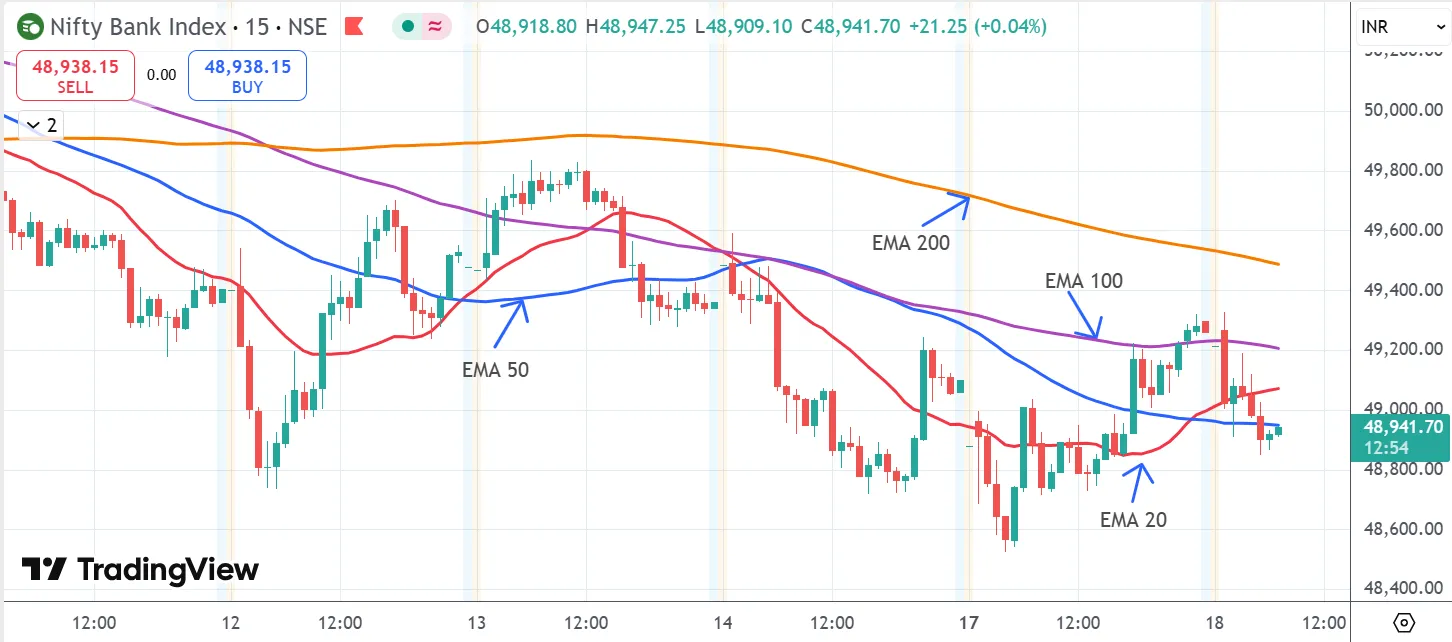
Imagine stacking several moving averages of different lengths on your chart. Typically, you might see many moving averages as per your strategy. The shorter-term averages sit closer to the price, while the longer-term ones trail behind. This arrangement creates a ribbon-like appearance that quickly tells you whether the market is trending upward, downward, or perhaps stalling.
How Does It Work?
The idea behind the ribbon is simple yet effective. Each moving average represents a different period, such as EMA 20,50,100 and 200
-
Longer-Term Averages: These give you a sense of the overall trend.
-
Shorter-Term Averages: They capture the immediate, more volatile price moves.
When you notice that the gap between these averages is widening, it typically signals a strong trend. On the flip side, if the lines begin to crowd together, the market might be entering a period of consolidation. Additionally, the outer moving averages can sometimes act like dynamic support in an uptrend or resistance in a downtrend.
Key Components to Keep in Mind
To get the most out of a Moving Average Ribbon, you should be aware of a few key settings:
- Initial Length: This is the period of the shortest moving average in your series. In the article EMA ribbon of 20.
- Step: It determines how much each subsequent moving average’s period increases.
- Type of Moving Average: Whether you choose an EMA, SMA, or even a HullMA can subtly change how the ribbon reacts.
- Offset: This adjusts the moving average so it aligns properly with the price data, helping to smooth out the visual presentation.
Why Use a Moving Average Ribbon?
Using a Moving Average Ribbon offers several advantages:
-
Clear Trend Visualization: The ribbon gives you an immediate snapshot of market direction.
-
Enhanced Decision-Making: With the trend’s strength and potential reversals clearly laid out, you can better time your entries and exits.
-
Support and Resistance: The outer lines of the ribbon often mark key levels where the price may bounce or reverse.
-
Signal Confirmation: Whether you are spotting a crossover in the ribbon’s, these cues can validate other signals you might be seeing.
When and How to Use It
There’s no one-size-fits-all answer, but here are some practical scenarios:
-
During Trending Markets: When the market is moving strongly in one direction, the ribbon helps confirm that momentum.
-
For Reversal Signals: Watch for moments when the shorter averages cross the longer ones, as this can signal a potential turnaround.
-
Dynamic Support/Resistance: Use the outer edges of the ribbon to identify zones where the price may find support in an uptrend or face resistance in a downtrend.
Trading Strategies Involving the Ribbon
There are a few common strategies traders often discuss:
-
Bullish/Bearish Crossovers: When the price crosses above the ribbon, it might be a bullish sign. Conversely, a dip below the ribbon could suggest a bearish move.
-
Slope Analysis: The direction of the ribbon’s slope upward for bullish trends and downward for bearish trends can be a reliable indicator of market direction.When all EMAs align closely in the same direction, it signals a potential trend formation, providing a strong indication for positional trades.
Using EMA Ribbons for Intraday and Swing Trading:
EMA ribbons can be effectively used for both intraday and swing trading strategies. For intraday trading, time frames like 5-minute or 15-minute charts are common. However, these shorter time frames tend to produce more noise, making it essential to be confident in your trade setups. In such cases, traders may prefer to scalp for smaller, quick profits.
For swing or positional setups, longer time frames like 30 minutes, 1 hour, or 1 day help reduce noise and provide a clearer view of the trend’s strength. This makes it easier to identify stronger trends and potential entry and exit points.
No matter the time frame, using proper stop-loss levels and maintaining a solid risk-to-reward ratio are crucial for minimizing risks and maximizing returns in any strategy.
Steps for Intraday Trading Using EMA Crossovers:
-
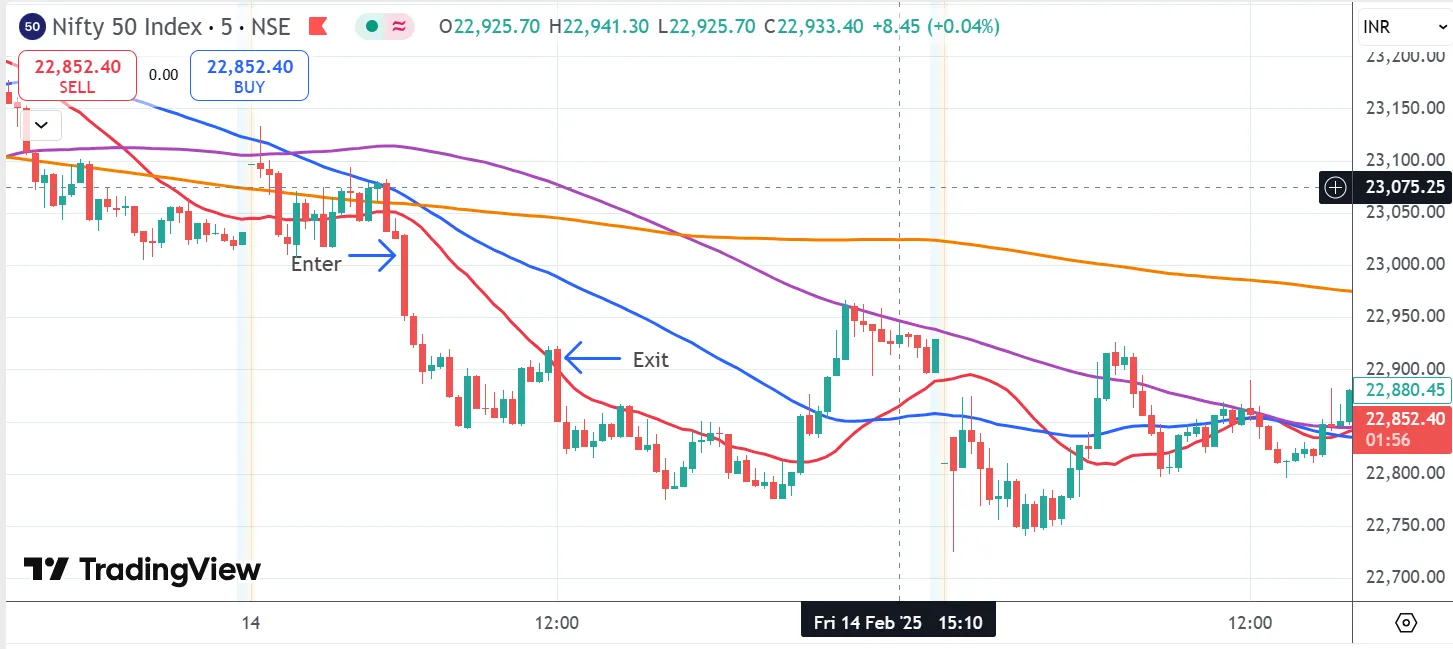
Entry Signal:
Enter the trade when the smaller EMA 20 crosses below the EMA 50. This indicates a potential short-term downward move.
-
Exit Signal:
Exit the trade when a candle closes aboe the EMA 20, signaling a potential trend reversal or weakening momentum.
-
Trade Duration:
Since this is an intraday setup aimed at capturing small price movements, aim for quick profits and avoid holding the trade for too long.
-
Stop-Loss Placement:
Place a stop-loss at a level that aligns with your risk tolerance and trading plan to protect your position from sudden reversals.
Steps for Using EMA Crossovers for Trade Entry and Exit:
-
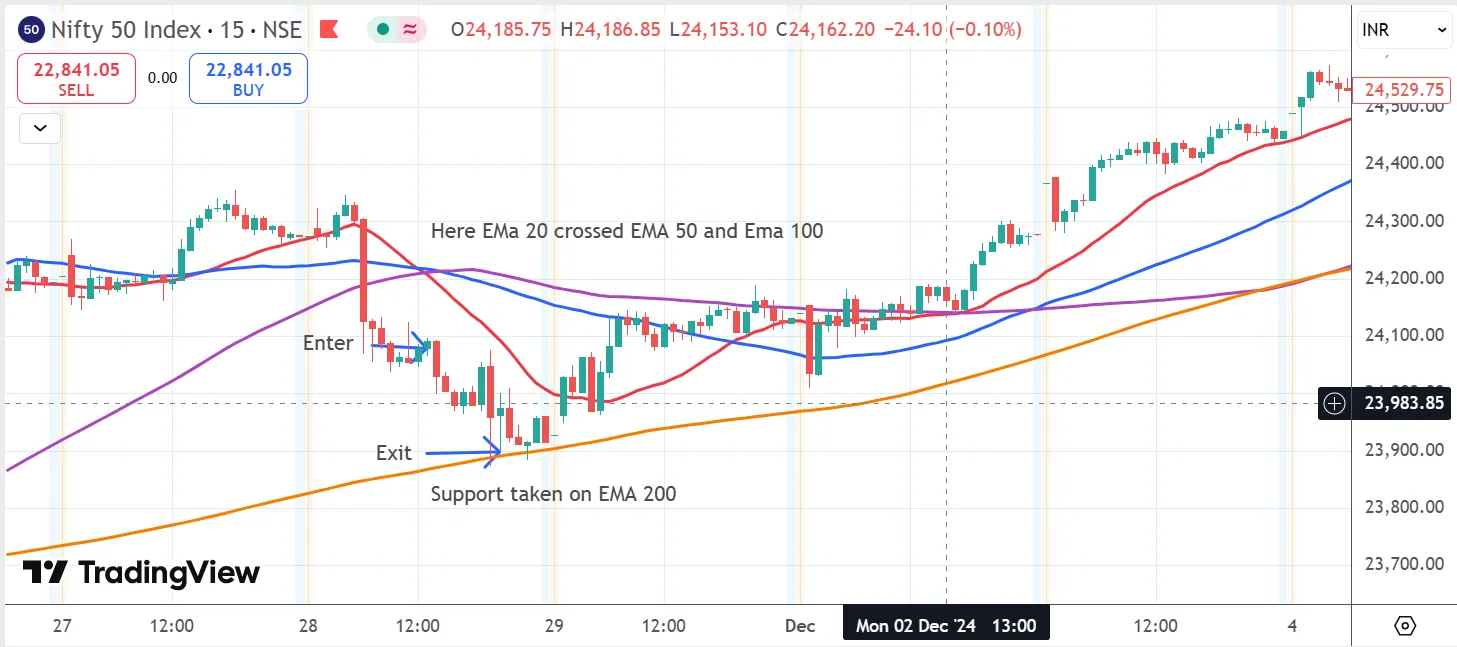
Entry Signal:
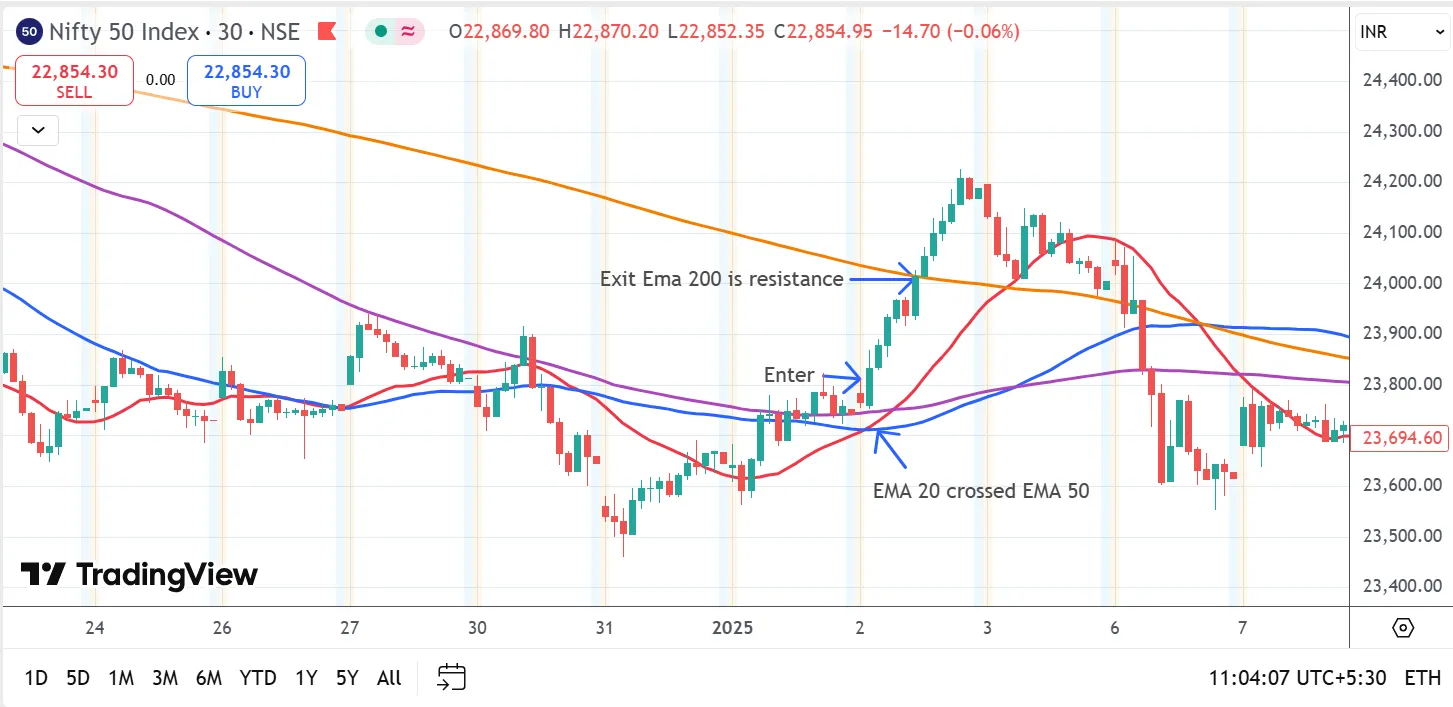
Enter the trade when the EMA 20 crosses above the EMA 50, indicating a potential upward trend.
-
Confirmation:
If the EMA 20 and EMA 50 also cross above the EMA 100, it provides stronger confirmation of the trade setup.
-
Resistance Level:
Monitor the EMA 200 as it may act as resistance. This becomes a potential exit point for the trade.
-
Stop-Loss Placement:
Set a stop-loss just below the closing of the candle that is under the EMA 20. This helps to protect against sudden reversals.
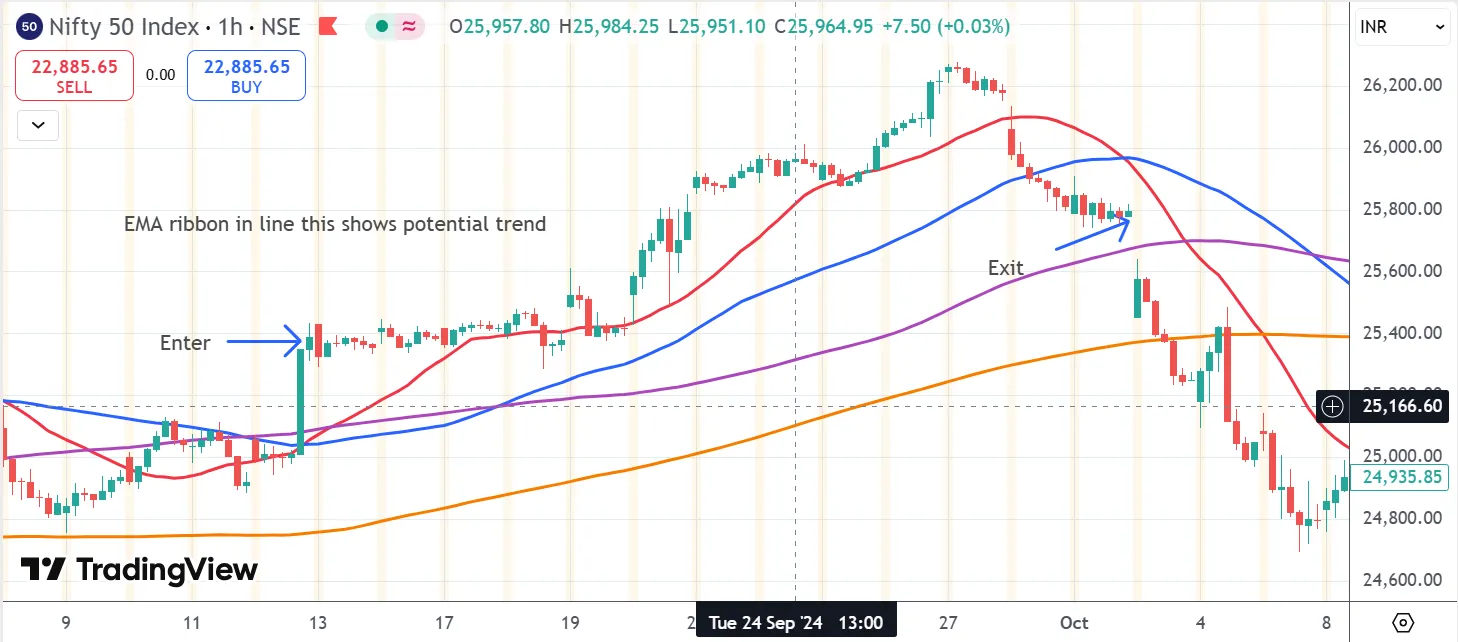
Steps for Using EMA Alignment for Trade Entry and Exit:
-
Entry Signal:
Enter the trade when the EMA 20 crosses above the EMA 50, EMA 100, and EMA 200. This alignment indicates a potential strong upward trend.
-
EMA Alignment:
Ensure that all EMAs are falling in line and slightly widened. This widening indicates trend strength and suggests that the trend may continue for a longer period.
-
Holding the Trade:
Keep the trade open as long as the EMA 20 does not cross below any of the other EMAs. This alignment acts as a signal for the continuation of the trend.
-
Exit Signal:
Treat the point where the EMA 20 crosses below any other EMA as the exit signal. This crossover suggests a potential trend reversal or weakening.
-
Stop-Loss Placement:
Set a stop-loss based on your risk-to-reward ratio to protect your trade in case of unexpected price movements. Adjust the stop-loss as the trade progresses to lock in profits.
Important Considerations
No trading strategy is foolproof. Consistent practice and backtesting are essential. Changing strategies frequently can lead to losses. It is important to understand the limitations of the Moving Average Ribbon, such as it being a lagging indicator that may not provide timely signals for short-term traders
Conclusion
In the world of trading, clarity and timing can make all the difference. The Moving Average Ribbon provides a unique, visual way to understand market trends and potential turning points. With a bit of practice and some careful backtesting, this tool can become a valuable part of your trading toolkit. Remember, every indicator has its limits—use it as one piece of your overall strategy and always stay disciplined in your approach.
Disclaimer: This article is for educational purposes only and does not constitute financial advice. Please consult a certified financial advisor before making any investment decisions.
Written by Suchitra
18th Mar 2025 / 6 Mins Read
Featured Posts

By Asma Torgal
8th July 2024
Stock Market Sentiment Drives Trading Decisions

By Tejaswi P
30th Aug 2024
Can Government Employees Do Trading in the Stock Market?
_11zon.webp?alt=media&token=bd974821-aee4-43a5-b467-01d1a67a570b)
By Suchitra
29th Mar 2025
Algo Trading in India Tech-Driven Strategies for Modern Investors
_20_11zon.webp?alt=media&token=6659b2e6-927e-42de-8375-e227e579f556)
By Asma Torgal
28th Mar 2025
Trading Across Time Zones, The Global Market Timings in IST
By
Fri Mar 21 2025
How to Use Parallel Channels, Trends & Patterns
_11zon.webp?alt=media&token=a8f3f55c-dc70-4d42-844e-6874ceff69ce)
By Suchitra
20th Mar 2025
Swing and Positional Trading with Pivot Points
_11zon.webp?alt=media&token=a05d2324-cace-44ed-a35f-50f9e63be9c3)
By Suchitra
13th Mar 2025
How Central Banks Influence Indian Stock Market Trends
_11zon.webp?alt=media&token=14cd8f87-8add-49ce-84f1-ca07a0c52b0c)
By Suchitra
12th Mar 2025
Two Essential Candlestick Patterns for Market Timing

By Suchitra
05th Mar 2025
How Algorithmic trading revolutionizes modern markets with efficiency and speed

By Asma Torgal
24th Sep 2024
Lot Size in Futures & Options Trading
.webp?alt=media&token=3e6c4b4a-4d06-4c88-8b81-ae1de55d2c42)
