Abandoned baby pattern signals bullish and bearish reversals
The Abandoned Baby candlestick pattern is a rare but reliable trend reversal signal appearing in bullish and bearish markets. This three-candle formation indicates a shift in market momentum—bullish patterns signal a buying opportunity, while bearish patterns warn of a sell-off.
Introduction
Have you ever wished for a clear signal that a trend is about to reverse? The abandoned baby pattern might be just what you are looking for. This rare but highly reliable candlestick formation appears in both bullish and bearish markets, signaling a major shift in momentum. A bullish abandoned baby tells you that sellers are losing control, making way for buyers to push prices higher. On the flip side, a bearish Abandoned Baby warns that an uptrend is running out of steam and a potential sell-off could be coming. If you can spot this pattern and confirm it with other indicators, it could give you a strong edge in your trading decisions.
Abandoned Baby (Bullish)
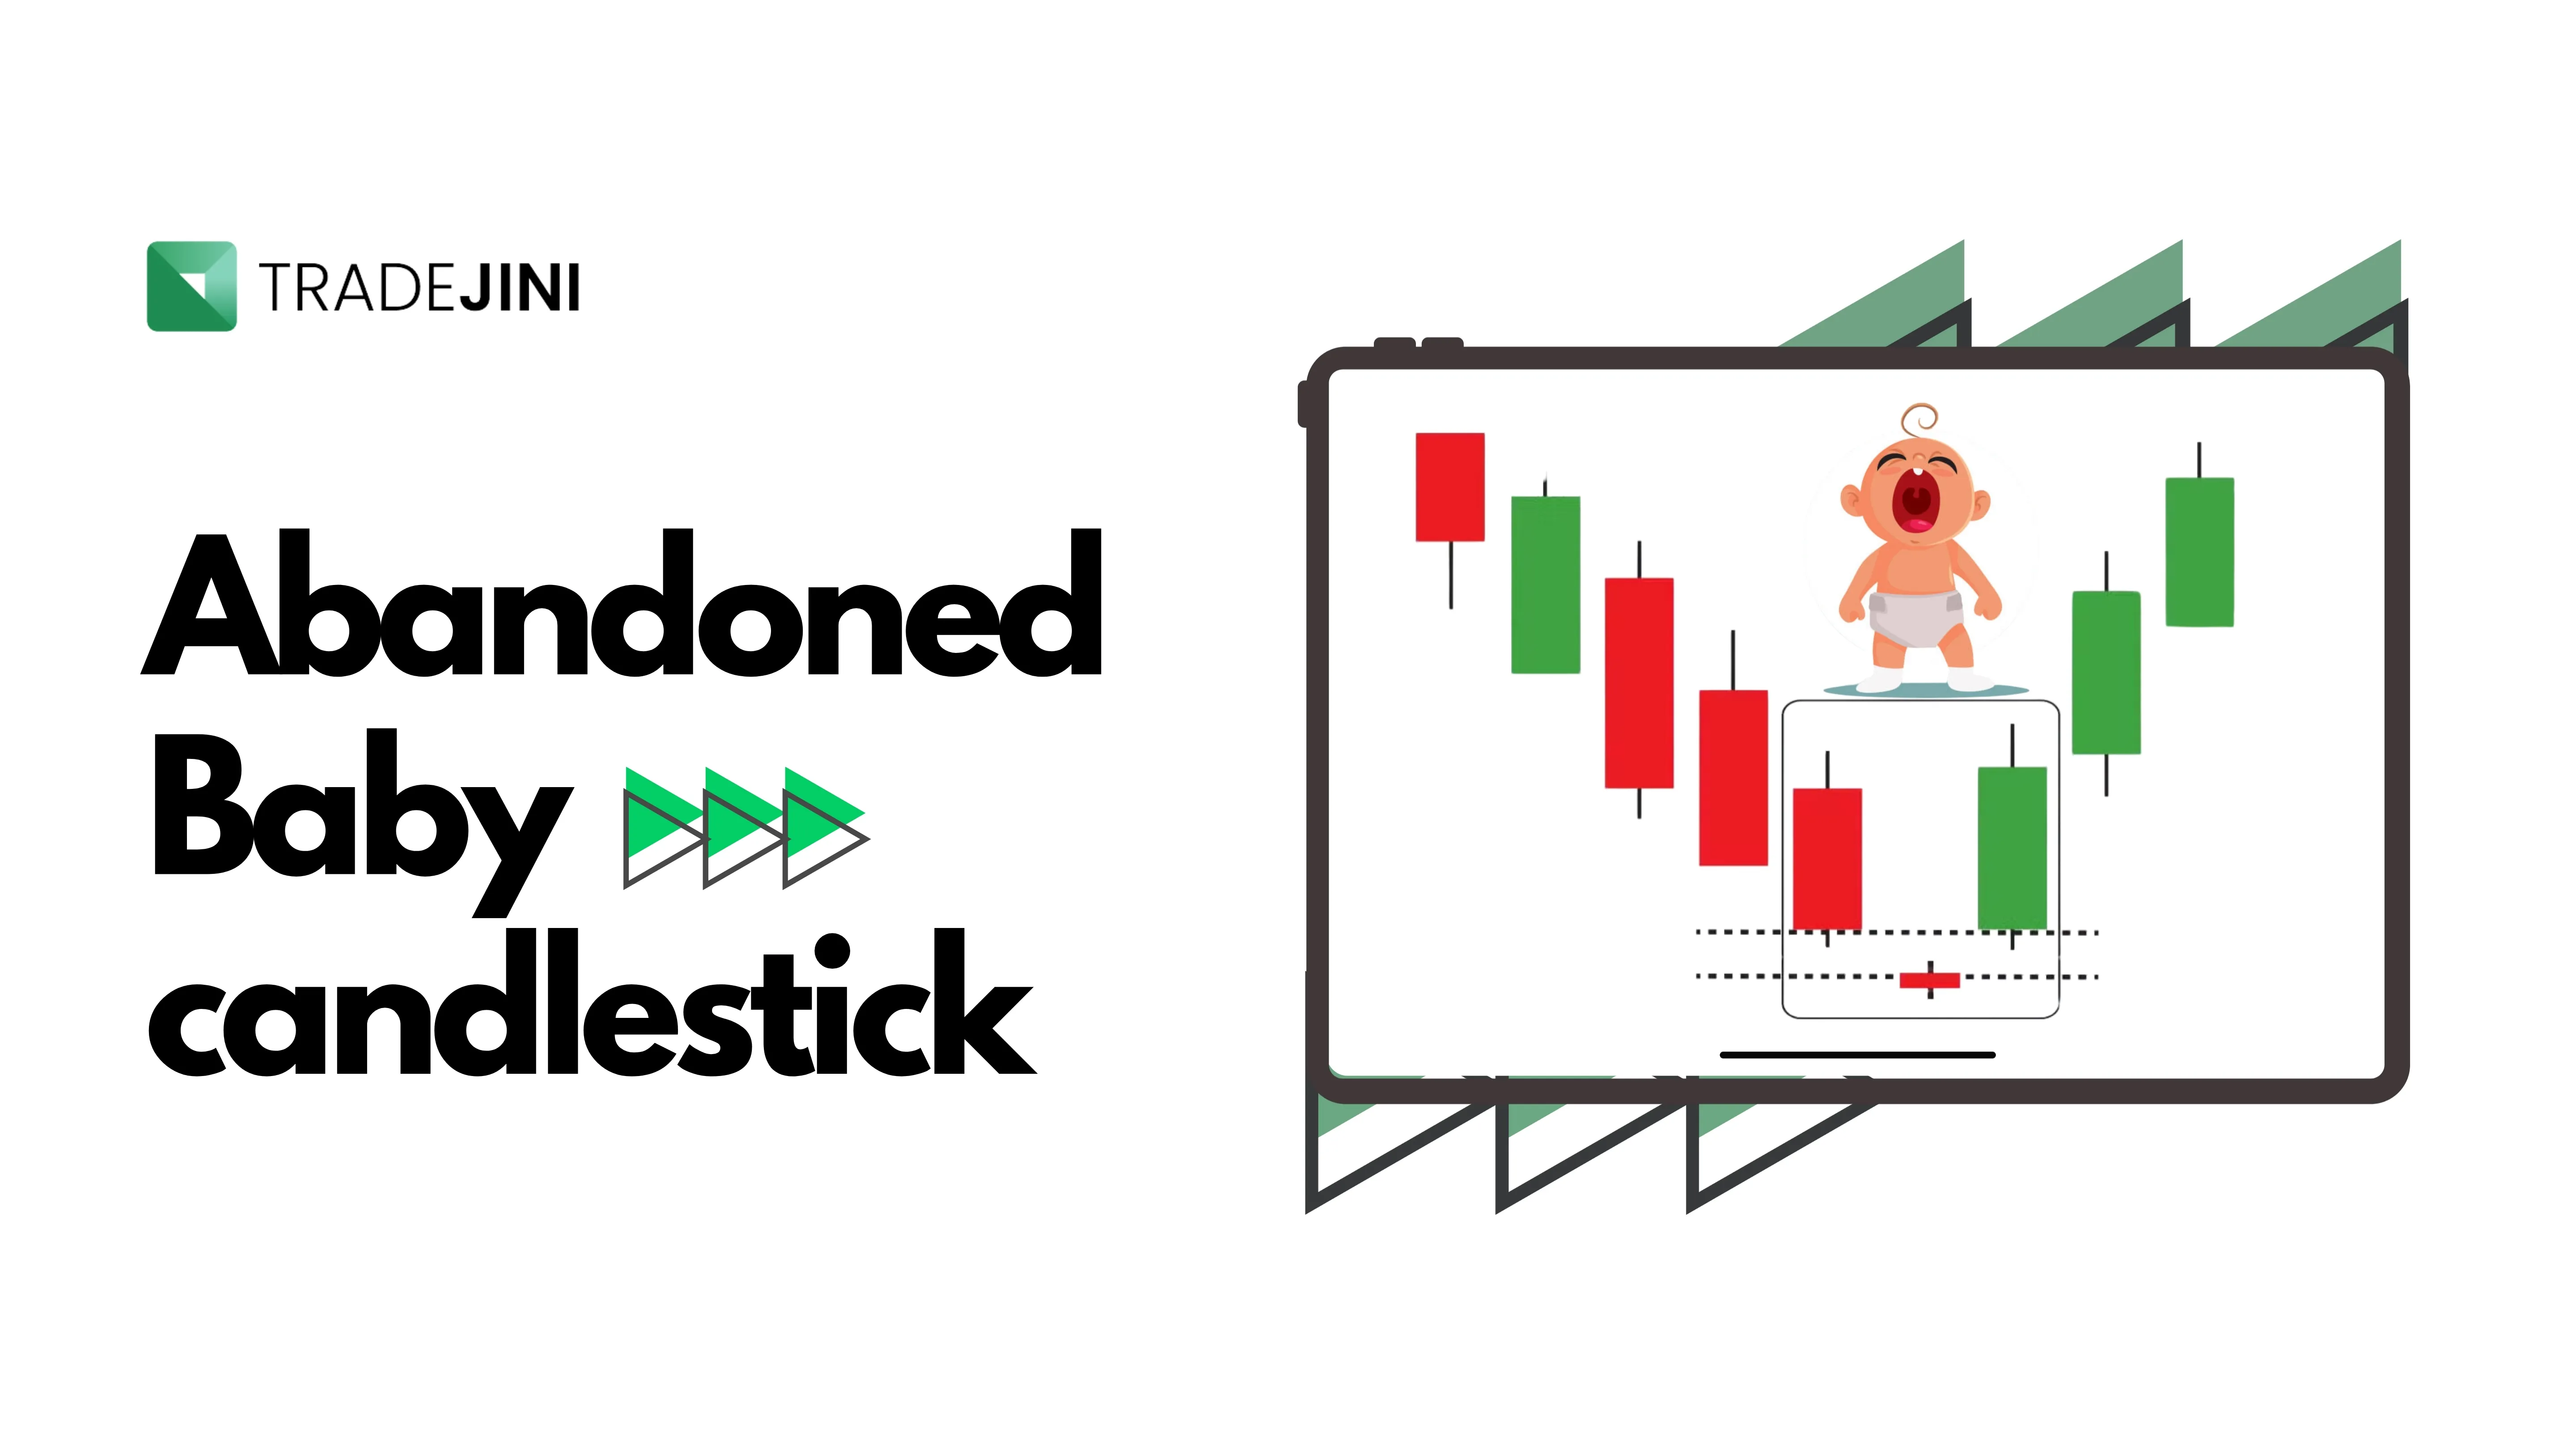
When you notice the steep downtrend and sellers seem unstoppable. Suddenly, a tiny candle forms with no overlapping; this is the sign of the abandoned baby pattern. It consists of three candles: What is it significant? This rare pattern signals a strong market reversal, often appearing after extended downtrends. The gaps highlight a shift in sentiment as buyers regain control and reverse the selling pressure.
Structure
-
1. First Candle: A long bearish (downward) candle, indicating strong selling pressure.
-
2. Second Candle: A doji candle that gaps down from the first, meaning its opening price is below the previous candle's close, and it has little to no real body, reflecting market indecision.
-
3. Third Candle: A long bullish (upward) candle that gaps up from the doji, closing well above the midpoint of the first candle, signifying a shift to buying momentum.
Significance:
This pattern highlights a dramatic shift in market sentiment. The initial bearish candle continues the downtrend, but the subsequent gap-down doji indicates hesitation among sellers. The final bullish candle, which gaps up and closes strongly, confirms that buyers have taken control, suggesting the start of an upward trend.
How to Trade:
-
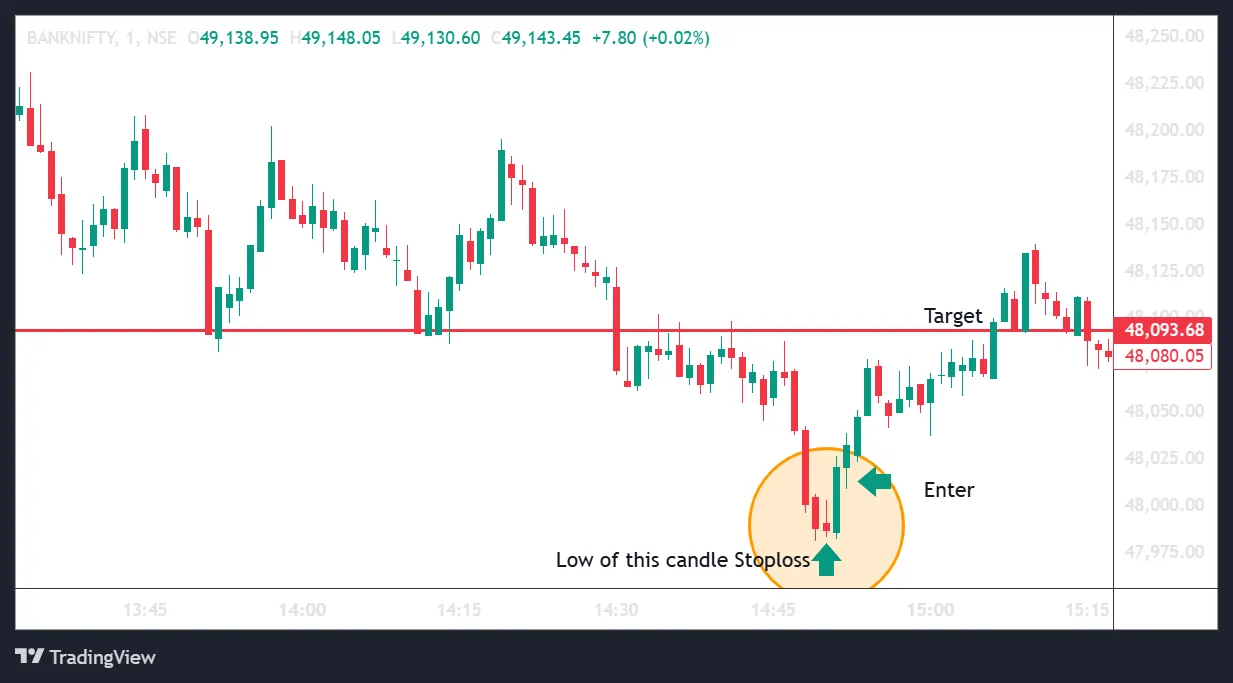
Confirmation: Wait for the third bullish candle to close decisively above the midpoint of the first bearish candle. A strong close with increased volume adds further confirmation that buyers have taken control, reducing the chances of a false signal.
-
Entry Point: Enter a long (buy) position at the opening of the next candle after confirmation.
-
Stop-Loss: Place a stop-loss order below the low of the doji (the second candle) to manage risk.
-
Target: Identify the nearest resistance level or use a risk-to-reward ratio of 1:2 to set your profit target.
Abandoned Baby Bullish with MACD
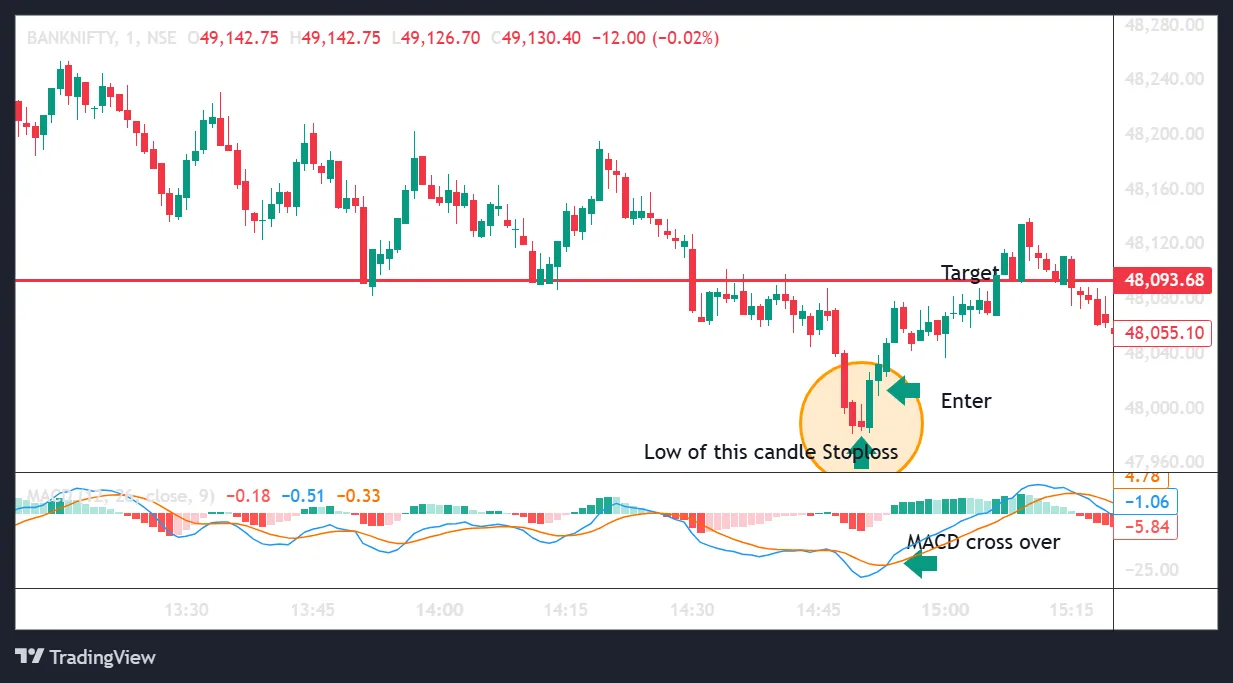
This pattern’s formation is very rare, which makes it highly reliable, but combining it with other indicators, like volume spikes or MACD, enhances its accuracy.
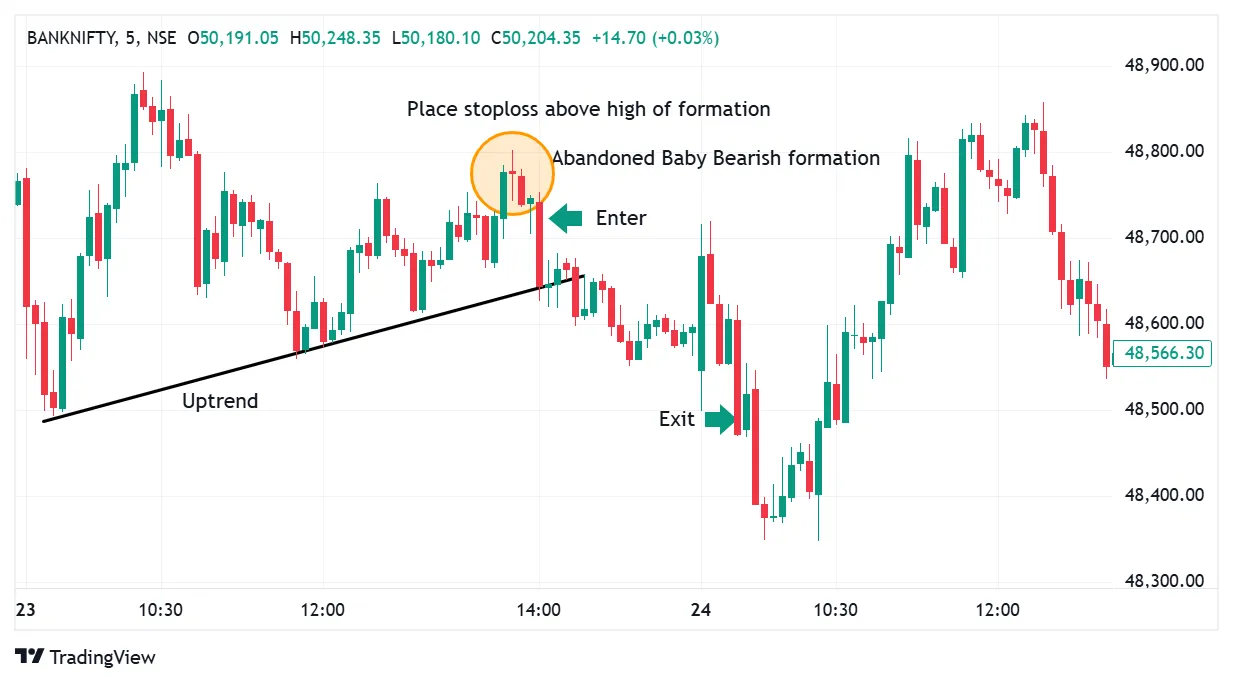
Abandoned Baby (Bearish)
Imagine a stock in a strong uptrend where buyers seem unstoppable. Suddenly, a tiny candle appears, completely isolated with no overlap from the previous or next candle. This is the abandoned baby (bearish) pattern, signaling a potential reversal from an uptrend to a downtrend.
Structure
-
First Candle – A long bullish (upward) candle, reflecting strong buying momentum.
-
Second Candle – A doji candle that gaps up from the first, meaning its opening price is above the previous candle's close. This doji has little to no real body, indicating market indecision.
-
Third Candle – A long bearish (downward) candle that gaps down from the doji and closes well below the midpoint of the first bullish candle, confirming a shift in momentum.
Significance
The pattern represents a sharp change in market sentiment. The strong initial bullish candle continues the uptrend, but the gap-up doji shows that buyers are losing strength. The final bearish candle, which gaps down and closes lower, confirms that sellers have gained control, signaling a potential downward trend.
How to Trade:
-
Confirmation: Wait for the third bearish candle to close decisively below the midpoint of the first bullish candle. A strong close with increased volume further confirms that selling pressure has taken over, reducing the chances of a false signal.
-
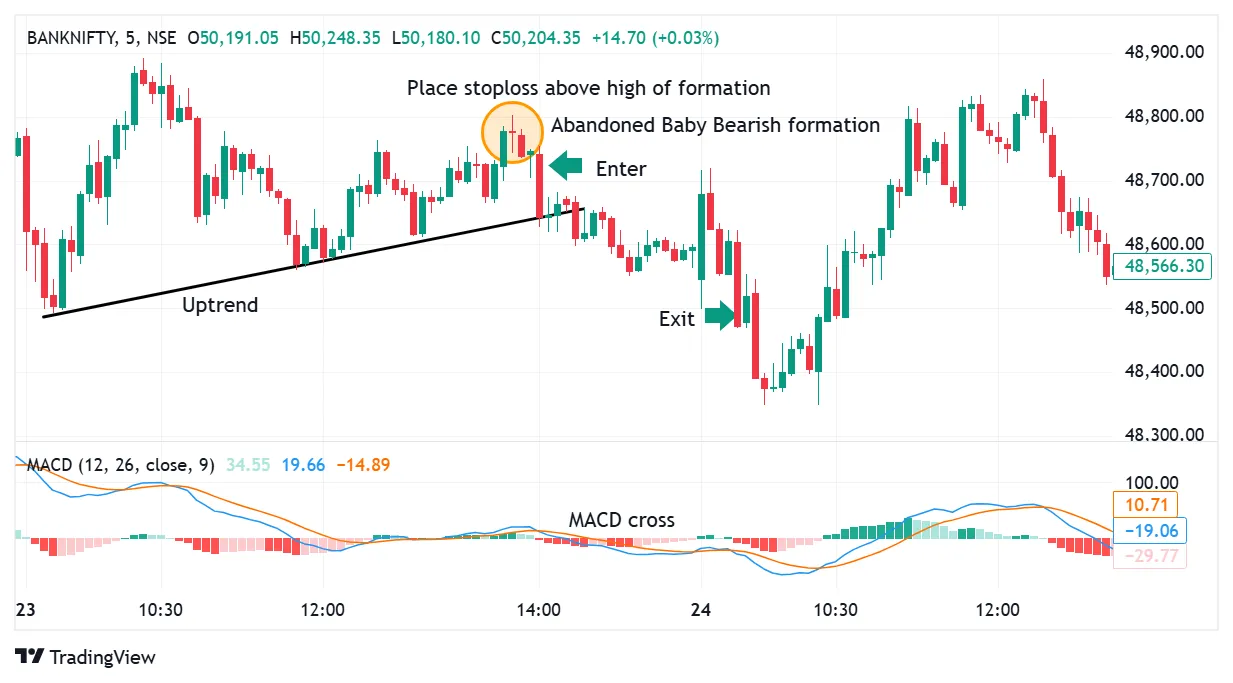
Entry Point: Enter a short (sell) position at the opening of the next candle after confirmation.
-
Stop-Loss: Place a stop-loss order above the high of the doji (the second candle) to manage risk.
-
Target: Identify the nearest support level as a profit target or use a risk-to-reward ratio of 1:2 to maximize returns.
Abandoned Baby (Bearish) with MACD
The abandoned baby (bearish) pattern is infrequent, which makes it very reliable to identify reversals. But by using it with other indicators like volume spikes or the MACD (Moving Average convergence divergence), it becomes more accurate. A bearish crossover of the MACD or a decrease in histogram bars with the pattern gives a stronger reversal signal to the traders, giving them more confidence before entering a trade.
Pattern Worth Noticing
The Abandoned Baby candlestick pattern is a rare but powerful signal that can hint at major market reversals. While it should not be used in isolation, combining it with indicators like MACD, volume analysis, or key support and resistance levels can improve trading accuracy. Spotting this pattern early can provide an edge, but the real challenge lies in execution—knowing when to act and when to wait for confirmation. In trading, it is not just about recognizing patterns but understanding the story they tell.
Written by Suchitra
07th Mar 2025 / 5 Mins Read
Featured Posts

By Asma Torgal
8th July 2024
Stock Market Sentiment Drives Trading Decisions

By Tejaswi P
30th Aug 2024
Can Government Employees Do Trading in the Stock Market?
_11zon.webp?alt=media&token=bd974821-aee4-43a5-b467-01d1a67a570b)
By Suchitra
29th Mar 2025
Algo Trading in India Tech-Driven Strategies for Modern Investors
_20_11zon.webp?alt=media&token=6659b2e6-927e-42de-8375-e227e579f556)
By Asma Torgal
28th Mar 2025
Trading Across Time Zones, The Global Market Timings in IST
By
Fri Mar 21 2025
How to Use Parallel Channels, Trends & Patterns
_11zon.webp?alt=media&token=a8f3f55c-dc70-4d42-844e-6874ceff69ce)
By Suchitra
20th Mar 2025
Swing and Positional Trading with Pivot Points
_11zon.webp?alt=media&token=a05d2324-cace-44ed-a35f-50f9e63be9c3)
By Suchitra
13th Mar 2025
How Central Banks Influence Indian Stock Market Trends
_11zon.webp?alt=media&token=14cd8f87-8add-49ce-84f1-ca07a0c52b0c)
By Suchitra
12th Mar 2025
Two Essential Candlestick Patterns for Market Timing

By Suchitra
05th Mar 2025
How Algorithmic trading revolutionizes modern markets with efficiency and speed

By Asma Torgal
24th Sep 2024
Lot Size in Futures & Options Trading