When Fibonacci Retracement Numbers Meet Market Psychology
When we buy and sell the stock, we usually see the prices of stocks either increase or decrease. However, at times, after a consistent increase, the price just starts coming down—a movement called a pullback. This actually raises the question how much will the price drop before it hits support?
That is where Fibonacci retracement kicks in — a curious combination of math, nature, and market psychology that attempts to address that question. It provides a way to help estimate potential support or resistance levels to these pullbacks which can assist traders in making better decisions.
Let us decode how a centuries-old number sequence is still being used today to understand market behavior, set entry and exit points, and manage risk.
Fibonacci: the numbers
The Fibonacci sequence begins like this:
0, 1, 1, 2, 3, 5, 8, 13, 21, 34, 55…
Each number is simply the sum of the two before it. It is simple, yet the pattern is found almost everywhere.
But here is where it gets interesting for traders: as the sequence progresses, dividing one number by the next gives you a ratio that stabilizes around 0.618—this is the famous Golden Ratio.
These ratios—0.236, 0.382, 0.618, and 0.786—are used as retracement levels in technical analysis. Many believe these levels reflect collective human behavior—where traders take profits, panic, or pile back in.
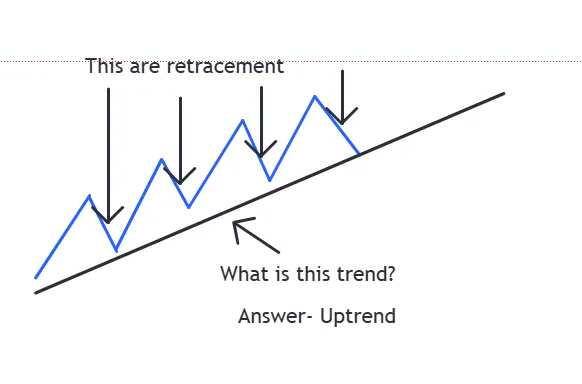
What is a retracement?
Before we dive into fibonacci retracement, let us understand retracement itself.
A retracement is a temporary reversal in the direction of a stock or index before it resumes its original trend.
And this is where Fibonacci comes in—to help traders estimate how far the pullback could go and where support or resistance may appear.
Below image depicts the uptrend what are retracement
How the price takes support and resistance on the fibonacci level shown in the below image
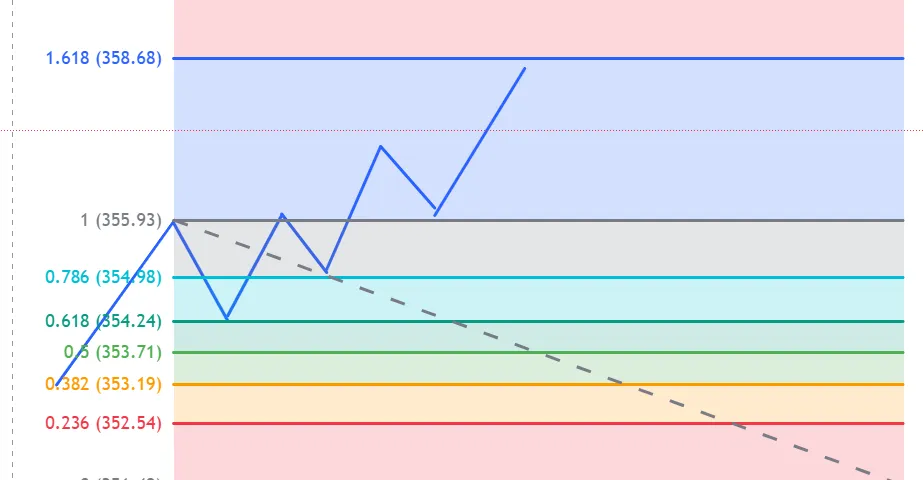
How traders use fibonacci retracement
Real stock example where the price respects fibonacci retracement levels.
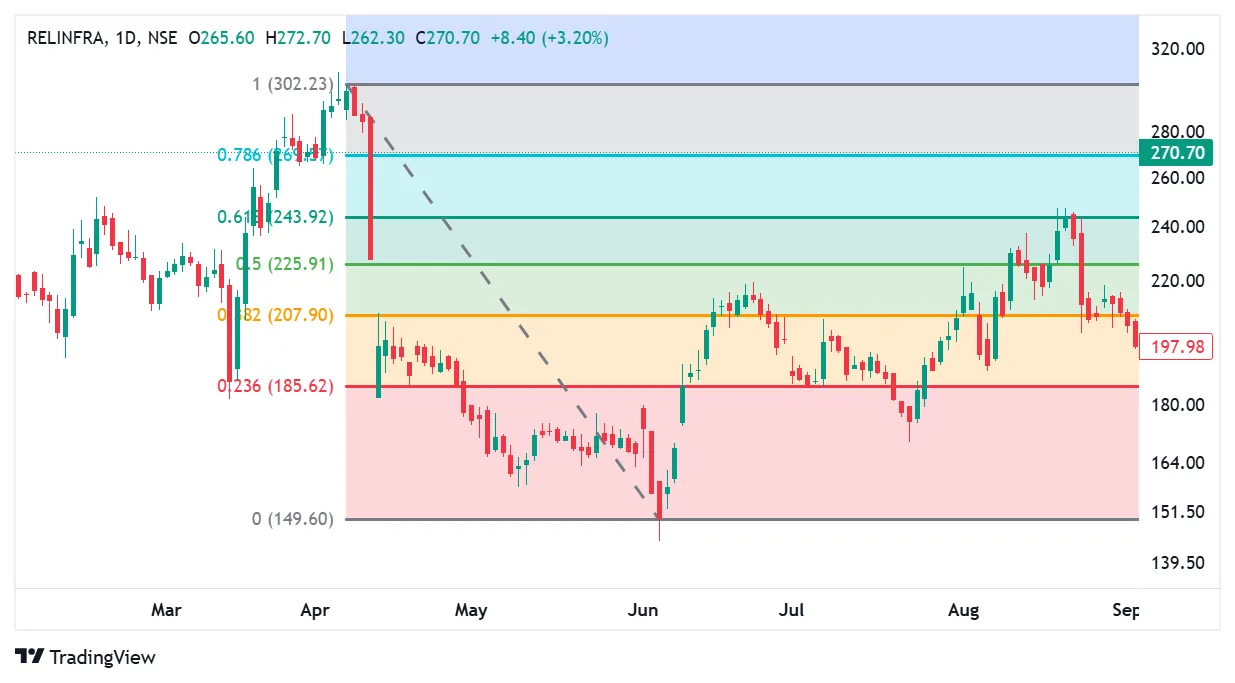
You can point out how price reacts at these levels:
-
After the sharp fall from ₹304 to ₹144, the price retraced upwards.
-
Support and resistance can be observed:
-
Near 207 (38.2%) – Acted as resistance during the initial bounce.
-
225.91 (50%) – was briefly breached and tested multiple times.
-
243.91 (61.8%) – acted as resistance recently.
-
Current Price: ₹255.50 – close to the 78.6% retracement, showing strong recovery.
-
These levels help identify possible support, resistance, and profit-booking zones. These lines are potential support levels—areas where the price may pause or reverse.
In a downtrend, you simply reverse the process: draw from Swing High to Swing Low, and the lines become resistance levels—where the bounce might run out of steam.
Best practices: making fibonacci work for you
To get the most out of Fibonacci retracement, consider these trading habits:
1. Identify the trend
Fibonacci works best in trending markets. If the stock is sideways or choppy, these levels may not offer much insight.
2. Use alongside other tools
Combine Fibonacci with other indicators like:
-
Moving Averages (e.g., 200-day MA)
-
RSI (for overbought/oversold signals)
-
Price Action or Candlestick Patterns
Confluence—when multiple tools agree—gives you higher conviction.
3. Look for confirmation
Never trade solely because a stock hits a Fibonacci level. Wait for signs of reversal—a bullish engulfing candle, an RSI bounce, or high volume.
4. Set logical stop-losses and targets
Fibonacci is not just about entry. It helps define:
-
Stop-losses just below support (or above resistance)
-
Target prices using Fibonacci extensions (like 161.8%, 261.8%) to predict how far the price could go after the bounce.
Real-stock example:
In March, a trader spotted INDIGO breaking its previous all-time high of ₹5,064 on 20th March 2025. After the breakout, the stock rallied, followed by a small correction.
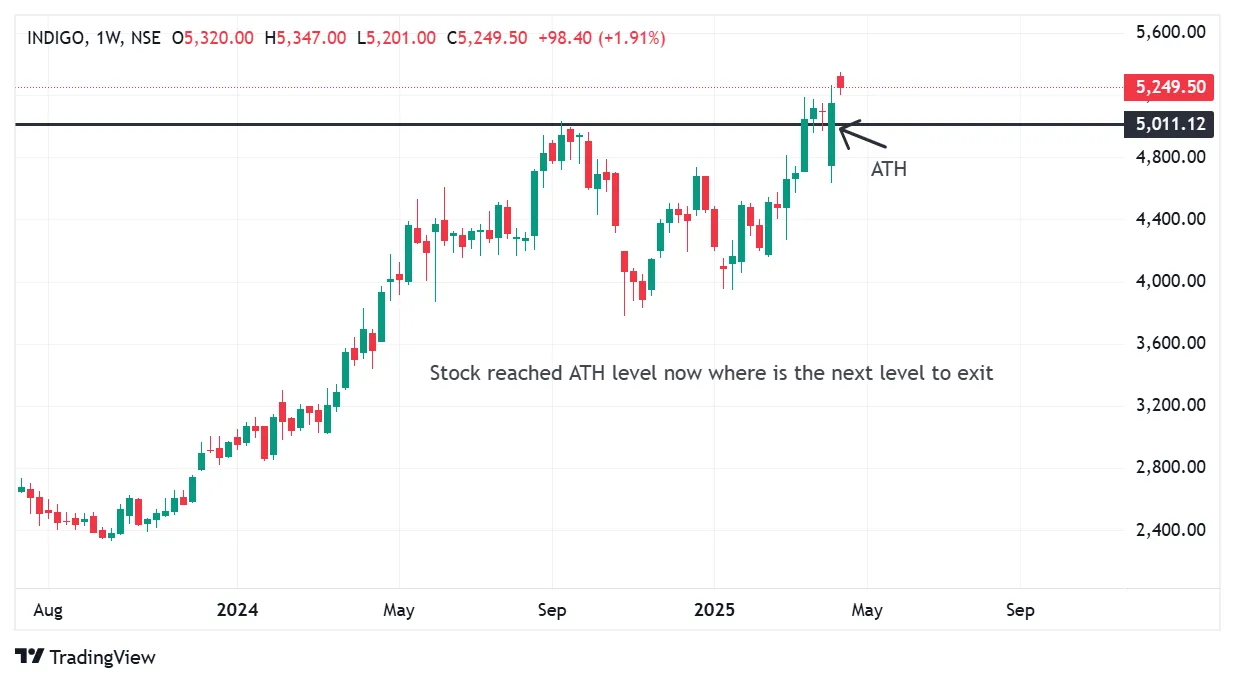
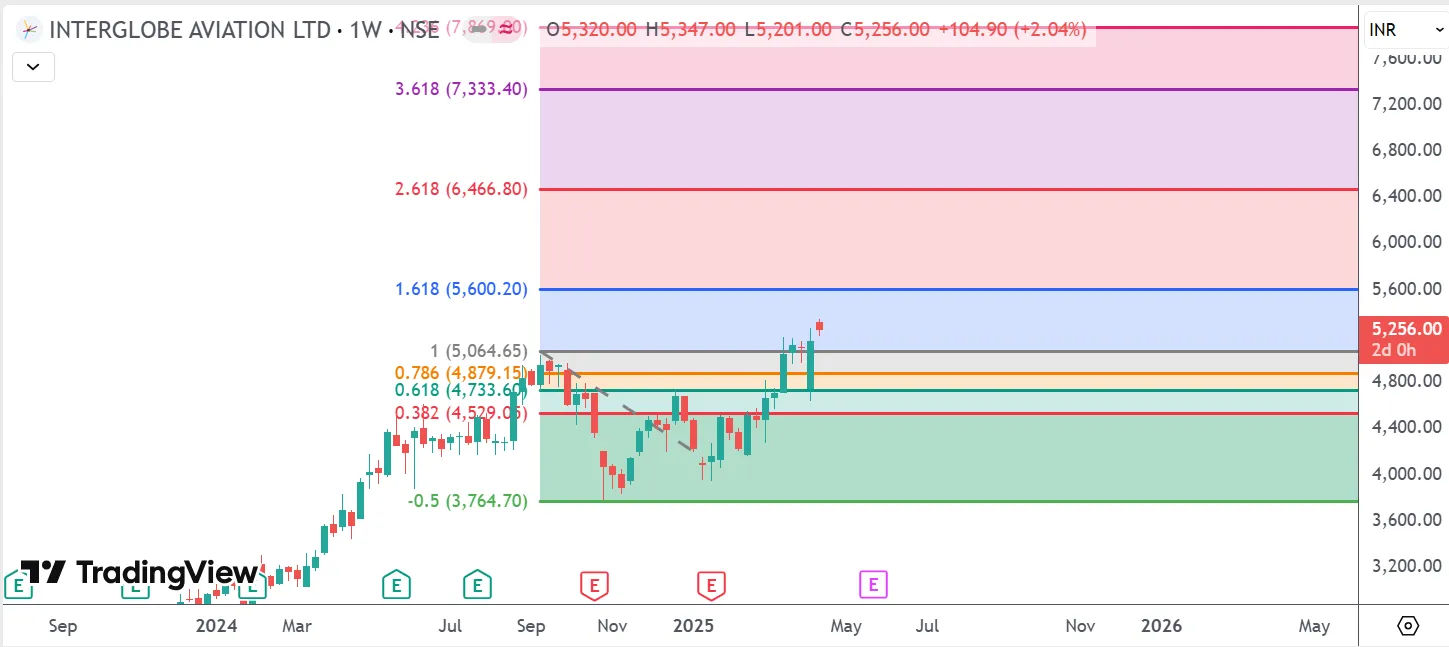
On 20th March 2025, INDIGO broke its previous all-time high, signaling a potential bullish breakout. When a stock enters uncharted territory with no past resistance, traders often rely on Fibonacci extension levels to identify possible next targets or exit zones.
Previous High (Fibonacci Level 1): ₹5064 – This level was decisively breached. Next Target Based on Fibonacci Extension (1.618 level): ₹5600
So, after the breakout, a trader entering at or just above ₹5111 can use the Fibonacci 1.618 extension level at ₹5600 as a potential profit booking zone.
Traders can use ₹5,600 as a potential exit level after entering above ₹5,064.
Example -2
On 25th March 2025, Reliance stock was in an uptrend, forming a series of higher highs and higher lows. However, when the price started forming lower highs and lower lows, Fibonacci levels were applied from the recent swing low to high to assess whether it was a temporary pullback or a potential trend reversal. These levels helped identify key support zones and provided insights into the strength of the trend.
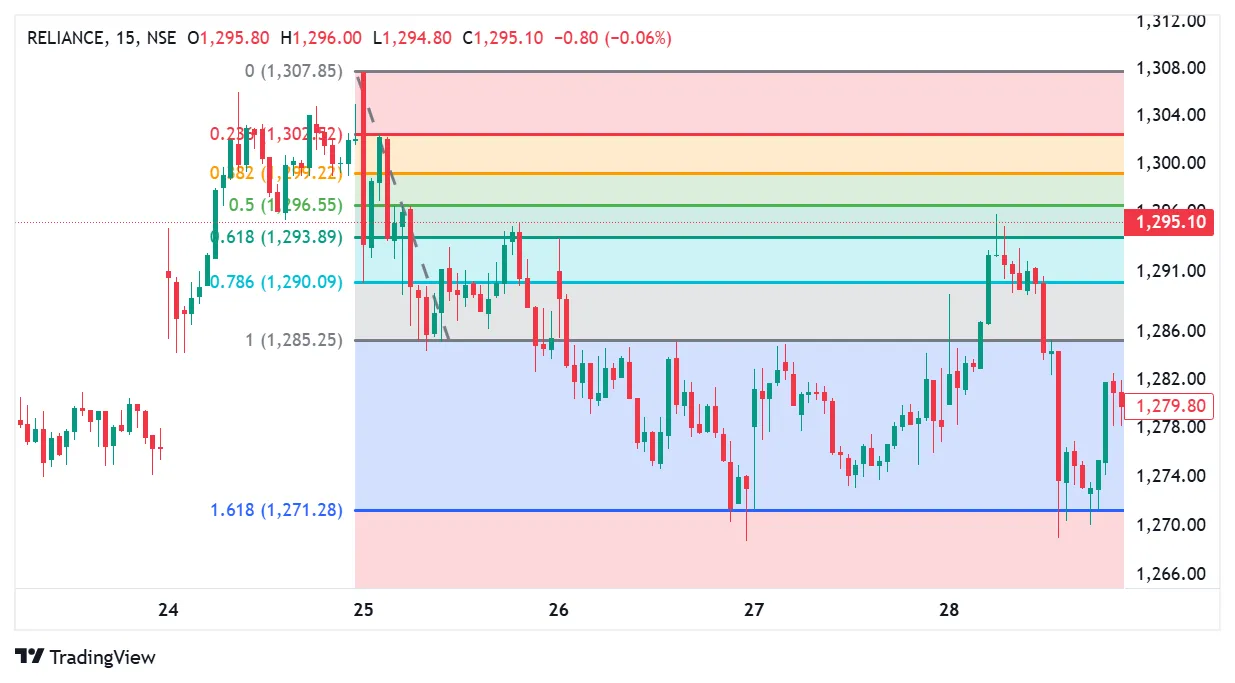
Observation on reliance stock:
The stock made its first lower high and lower low, indicating a possible shift in trend. Fibonacci levels were applied from the recent low to high. The price retraced to the 0.236 level at ₹1288 and faced resistance. It then attempted to move towards the 0.382 level at ₹1291 but faced selling pressure again.
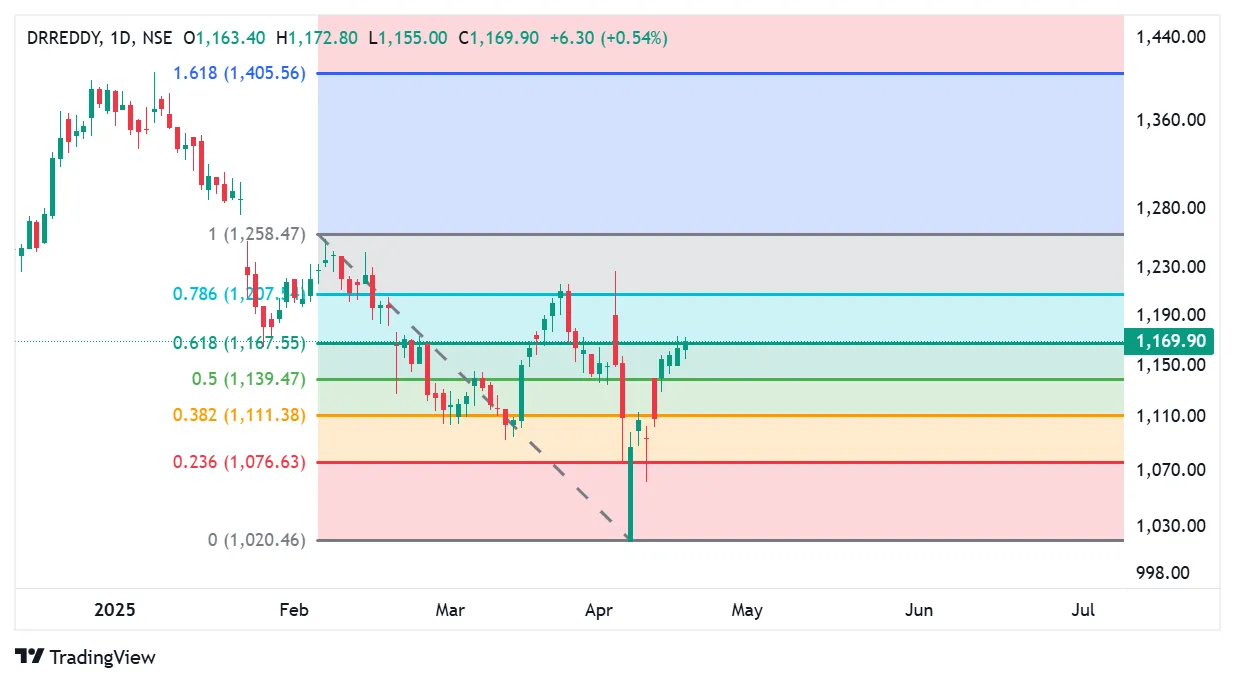
Example -3
Looking at this chart of Dr. Reddy's, the price is currently hovering near the 0.618 retracement level as on 21st April 2025 after a bounce from 1019 level.
Question:
If the price breaks above the 0.618 level with strong volume, which Fibonacci level might act as the next major resistance?
A) 786
B) 1
C) 1.618
Limitations you must know
-
Subjective Anchoring: Two traders might pick different highs and lows, leading to different levels.
-
Does Not Work in Isolation: Relying only on Fibonacci without context (news, volume, trend strength) is risky.
-
Market Noise: In highly volatile or news-driven markets, prices can cut through levels without reacting.
Think of Fibonacci as a compass—not a GPS. It points you in a direction, but you still need to navigate the terrain.
A thought to ponder
Why do traders around the world, across assets—from gold to crypto—keep going back to these numbers from the 13th century?
Because, deep down, markets are not just numbers. They are human behavior in motion. Fibonacci, in a way, is the mathematics of human nature.
And if we understand how humans behave in groups—especially when money is involved—we gain an edge.
Whether you are a beginner or a seasoned trader, adding Fibonacci to your toolkit can give you an edge—as long as you use it with context, logic, and caution.
So, the next time you look at a chart and wonder, ‘Where might this stock go next?’—try drawing those retracement lines. You might just find the market’s next move hidden in nature’s old rhythm.
Written by Suchitra
21th Apr 2025 / 6 Mins Read
Featured Posts

By Asma Torgal
8th July 2024
Stock Market Sentiment Drives Trading Decisions

By Tejaswi P
30th Aug 2024
Can Government Employees Do Trading in the Stock Market?
_11zon.webp?alt=media&token=bd974821-aee4-43a5-b467-01d1a67a570b)
By Suchitra
29th Mar 2025
Algo Trading in India Tech-Driven Strategies for Modern Investors
_20_11zon.webp?alt=media&token=6659b2e6-927e-42de-8375-e227e579f556)
By Asma Torgal
28th Mar 2025
Trading Across Time Zones, The Global Market Timings in IST
By
Fri Mar 21 2025
How to Use Parallel Channels, Trends & Patterns
_11zon.webp?alt=media&token=a8f3f55c-dc70-4d42-844e-6874ceff69ce)
By Suchitra
20th Mar 2025
Swing and Positional Trading with Pivot Points
_11zon.webp?alt=media&token=a05d2324-cace-44ed-a35f-50f9e63be9c3)
By Suchitra
13th Mar 2025
How Central Banks Influence Indian Stock Market Trends
_11zon.webp?alt=media&token=14cd8f87-8add-49ce-84f1-ca07a0c52b0c)
By Suchitra
12th Mar 2025
Two Essential Candlestick Patterns for Market Timing

By Suchitra
05th Mar 2025
How Algorithmic trading revolutionizes modern markets with efficiency and speed
By Asma Torgal
24th Sep 2024
Lot Size in Futures & Options Trading