Hull Moving Average vs.Traditional Averages
_11zon.webp?alt=media&token=62f7ef79-98cb-47d7-9601-32d0e0672489)
The Hull Moving Average (HMA), developed by Alan Hull, is a trend-following indicator designed to minimize lag while providing smoother signals than traditional moving averages like SMA and EMA. This article explains how HMA works, its unique calculation method, and its benefits for traders. It covers HMA-based trading strategies, including scalping and swing trading, while also discussing its strengths and limitations. Whether you're a short-term trader or a long-term investor, the HMA can help refine your market analysis and improve trade timing.
The Hull Moving Average (HMA), developed by Alan Hull in 2005, was designed to overcome the limitations of traditional moving averages like the Simple Moving Average (SMA) and Exponential Moving Average (EMA). While SMA and EMA often lag behind price movements, making it difficult for traders to react quickly, the HMA offers a smoother, more responsive indication of price trends. By reducing lag and noise, the HMA helps traders identify trends with greater accuracy, providing clearer entry and exit signals.
In this article, you will learn how the HMA differs from SMA and EMA, its ability to enhance trend identification, and how it improves trading strategies. The HMA enables more timely decision-making by offering a faster and more reliable tool for spotting market trends, making it an essential part of a trader's toolkit.
What Is the Hull Moving Average?
At its core, the HMA is a trend-following indicator that uses weighted moving averages (WMAs) to emphasize recent price data. Unlike the simple moving average (SMA), which assigns equal weight to every data point, the HMA prioritizes the most recent prices. This design minimizes the lag commonly found in other moving averages, giving you a more timely signal of the market’s direction. As a result, whether you are monitoring short-term swings or long-term trends, the HMA offers an enhanced view of market momentum.
How Does It Work?
The magic behind the HMA lies in its unique calculation process. It involves a series of WMAs combined in a clever way:
-
Weighted Emphasis First, the HMA calculates the WMA for half the desired period (n/2) and also for the full period (n). The shorter WMA is multiplied by 2, which accentuates recent price movements.
-
Lag Reduction Through Smoothing The formula then subtracts the full-period WMA from this doubled shorter-period WMA:
Raw HMA = 2 × WMA(n/2) – WMA(n)
This step shifts the moving average closer to the latest price action. Finally, a further smoothing is applied by calculating the WMA of the raw HMA over a period equal to the square root of n:
HMA = WMA(√n) of [2 × WMA(n/2) – WMA(n)]
This combination of emphasizing recent data and smoothing out fluctuations results in an indicator that reacts quickly to price changes without sacrificing the clarity of its trendline.
How Does HMA Compare to Other Moving Averages?
When you stack the HMA up against traditional tools like the SMA or the Exponential Moving Average (EMA), its advantages become clear:
-
HMA Versus SMA: The SMA is simple and easy to compute but is notorious for its lag. By contrast, the HMA’s weighted approach means it follows price more closely, providing signals sooner than an SMA would.
-
HMA Versus EMA: The EMA does a better job than the SMA by weighting recent prices more heavily; however, it can still lag during rapid market moves. The HMA takes this concept further with its multi-step calculation, almost eliminating lag while maintaining a smooth curve a feature that many traders find invaluable for quick decision-making.
Scalping vs. Swing Trading with the Hull Moving Average (HMA)
Scalping and swing trading are two popular trading strategies, each with unique approaches to market trends when using the Hull Moving Average (HMA).
Scalping involves capturing small price movements over short timeframes, such as 1-minute or 5-minute charts. In this fast-paced strategy, traders typically set the HMA to shorter periods (e.g., 9 or 13) to quickly identify rapid price changes. While this heightened sensitivity can produce more frequent entry and exit signals, it also increases the likelihood of whipsaws in volatile conditions. Effective risk management, such as tight stop-loss orders, is crucial to limit potential losses from sudden price reversals.
Swing Trading, in contrast, focuses on capturing larger price moves over several days or weeks. Traders often use longer HMA settings (e.g., 20 or 50 periods) to smooth out short-term price fluctuations and emphasize the overall trend. This approach reduces the frequency of trade signals but helps filter out market noise, allowing traders to identify high-probability setups for extended price movements. Swing trading with the HMA is ideal for those seeking a more patient, trend-following strategy without constantly monitoring charts.
Complementary Tool: While the HMA is powerful on its own, it can be even more effective when used with other indicators such as the Relative Strength Index (RSI) or MACD. This combination helps filter out false signals and provides additional confirmation for your trades.
The HMA is versatile and can be adapted to various trading styles:
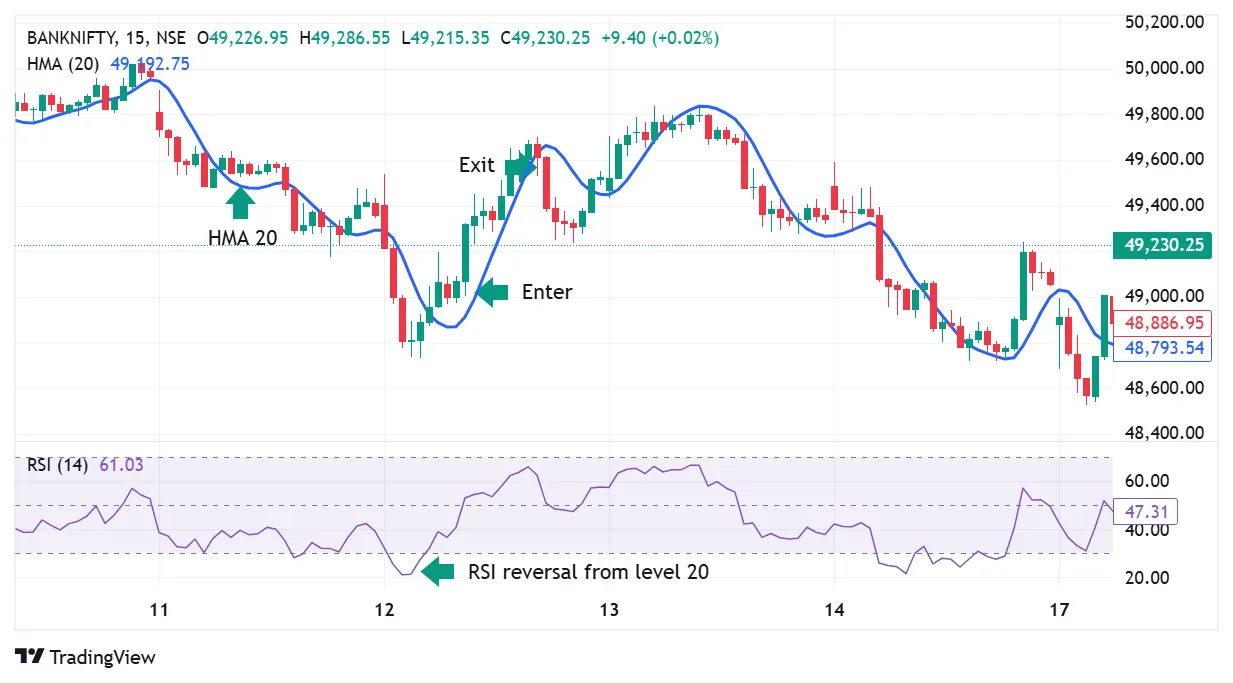
1) Trading strategy- HMA 20 with RSI
To implement a trading strategy that combines the 20-period Hull Moving Average (HMA) with the Relative Strength Index (RSI), follow these guidelines:
Entry Criteria:
Price Action Confirmation:
- Wait for a candlestick to close above the 20-period HMA.
- Enter a trade when a subsequent candlestick breaks above the high of the candlestick that closed above the HMA.
RSI Confirmation:
- Ensure that the RSI indicates a reversal signal. This can be identified when the RSI exits overbought or oversold territories, suggesting a potential change in trend direction.
Exit Criteria:
- Close the trade when a candlestick closes below the 20-period HMA.
Stop-Loss Placement:
- Set a stop-loss at a level that maintains a risk-to-reward ratio of 1:2. Alternatively, use the closing of a candlestick below the 20-period HMA as a stop-loss trigger, whichever condition is met first.
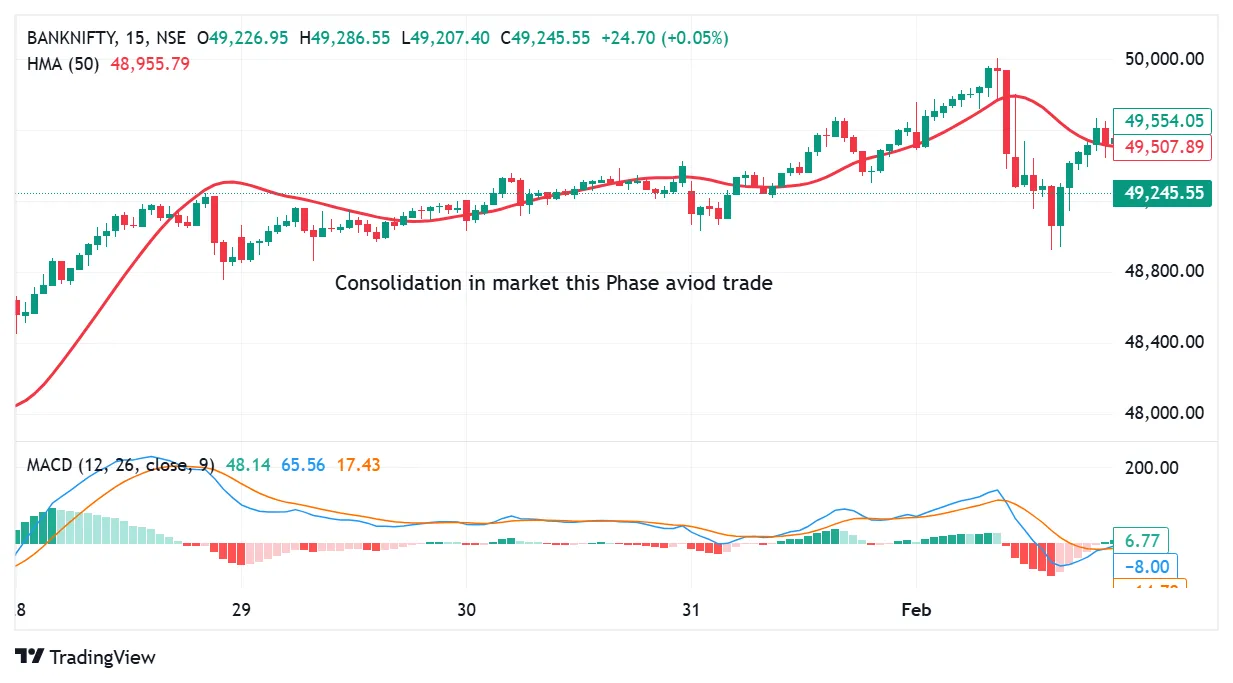
When you see candle slosing above and below HMA but HMA seems to be flat that time always add supporting indicator to confirm you about he trad here in below image HMA candle were closing above and below but hMA was flat when MACD applied to chart MACD also reflected the flat line both moving averages running together in this cases it is always good to avoid trade
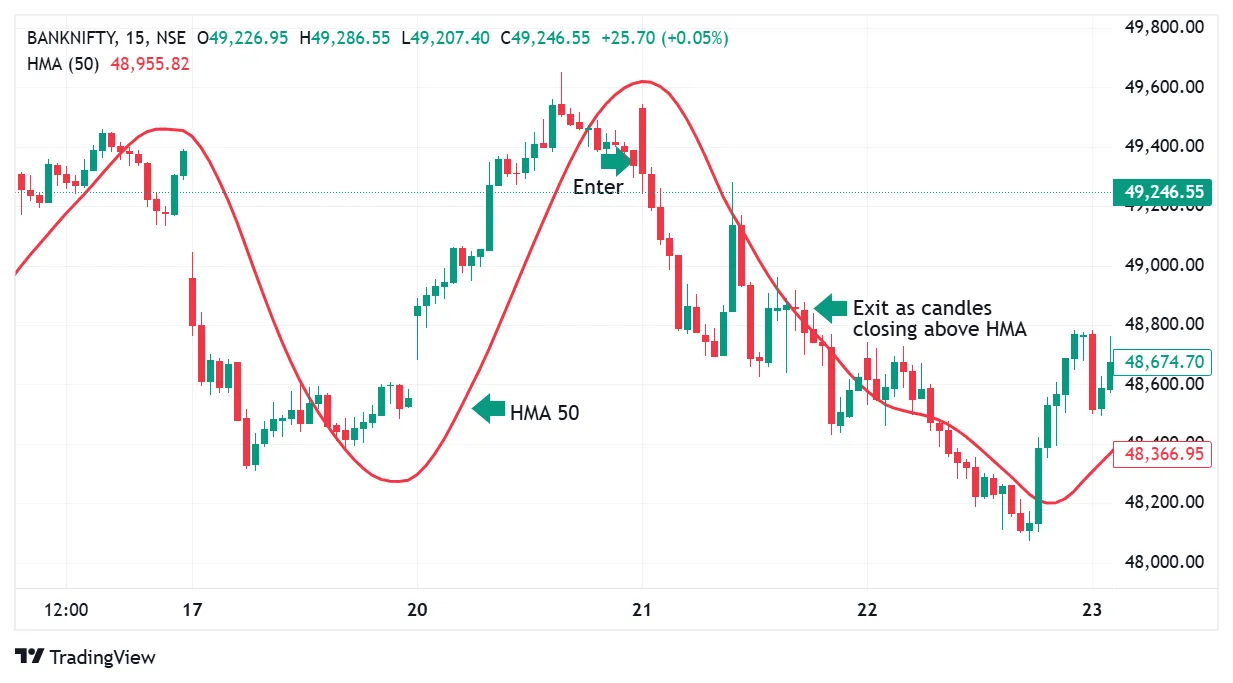
2) Trading Strategy: HMA 50
To implement a trading strategy using the 50-period Hull Moving Average (HMA) without additional indicators, follow these detailed guidelines:
Entry Criteria: Price Action Confirmation:
- Wait for a candlestick to close below the 50-period HMA.
- Enter a trade when a subsequent candlestick breaks below the low of the candlestick that closed below the HMA.
Exit Criteria:
- Close the trade when a candlestick closes above the 50-period HMA.
Stop-Loss Placement:
- Set a stop-loss at a level that maintains a risk-to-reward ratio of 1:2.
- Alternatively, use the closing of a candlestick above the 50-period HMA as a stop-loss trigger, whichever condition is met first.
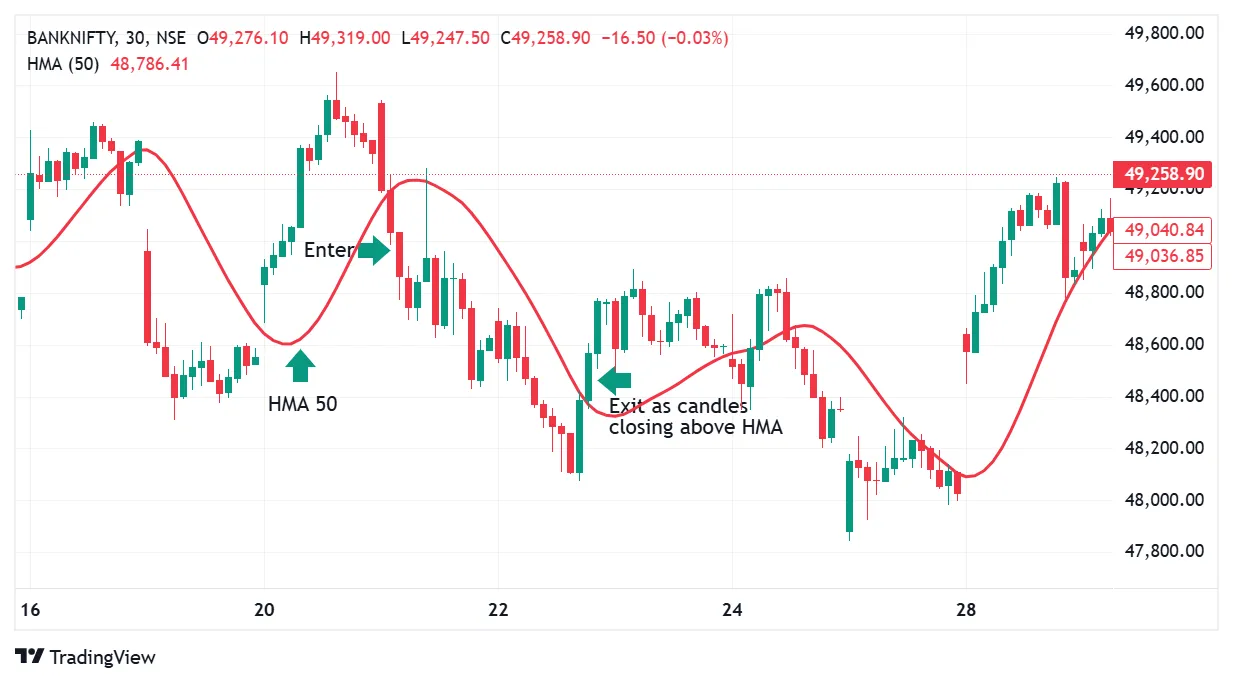
This simple strategy helps traders identify bearish trends with clearer price movement confirmation using the HMA 50. Always manage risk carefully and consider using additional technical analysis for validation.
In the image below, the HMA 50 is applied on a 30-minute timeframe, which helps reduce market noise and provides clearer entry signals. This setup generated nearly 500 points on the index.
When the Hull Moving Average (HMA) is flat and candlesticks close both above and below it, indicating a sideways market, it is prudent to avoid trading due to unclear trends. Incorporating additional indicators like the Moving Average Convergence Divergence (MACD) can provide further confirmation. If both the HMA and MACD display flat lines with their moving averages running closely together, it suggests minimal momentum and a non-trending market. In these cases, it is advisable to wait for clearer directional signals before entering a trade.
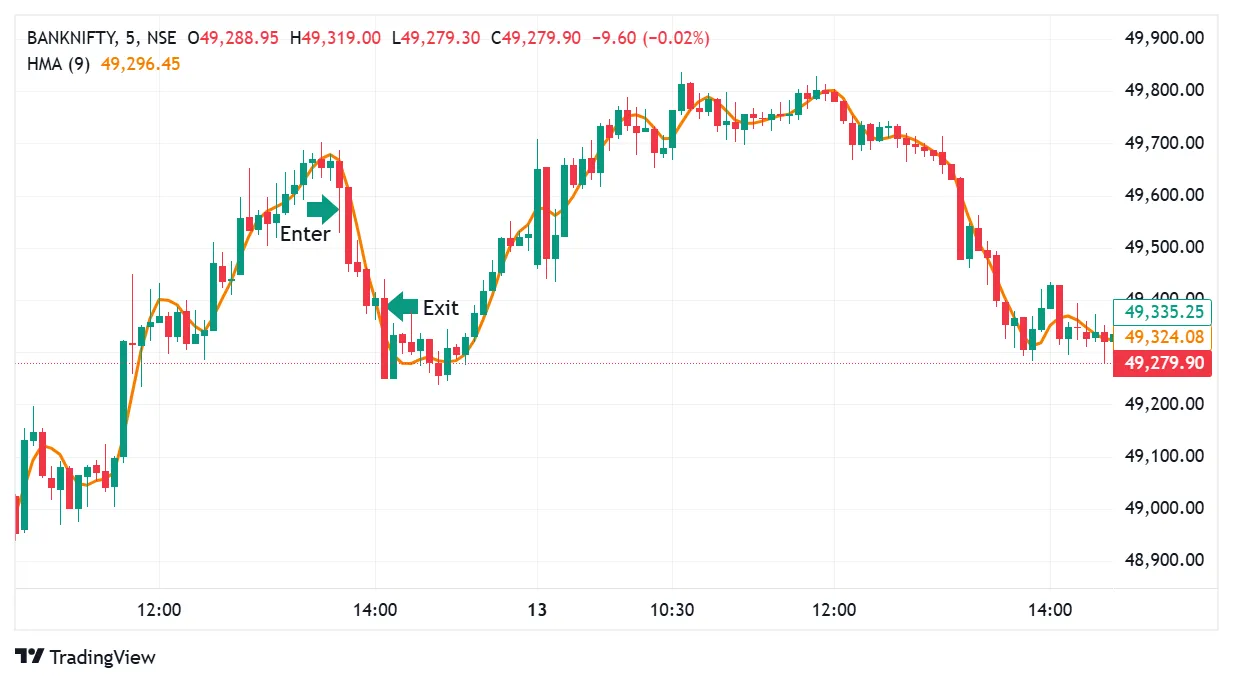
For scalping
Using the HMA 9 on a 1-minute to 5-minute timeframe can help capture small price movements. However, it may generate numerous false signals and frequent buy-sell alerts, creating significant market noise. As shown in the image below, a trade entry is signaled when a candle closes below the HMA 9, and the exit is triggered when a candle closes above the HMA 9. This time frame and HMA 9 can be used who wants to capture fews points and is sure bout the move.
Points of Caution
No indicator is without its drawbacks. Although the HMA reduces lag significantly, its complexity means that it may be more susceptible to ‘whipsaws’ during highly volatile or sideways markets. Alan Hull himself advises against using simple crossover signals with the HMA instead, focusing on turning points to define your entry and exit can be a more reliable approach.
Conclusion
The Hull Moving Average stands out as a trader’s secret weapon by offering a fast, smooth, and responsive means of tracking price trends. Its unique calculation minimizes lag—a common shortcoming of traditional moving averages—while still providing a clear view of the market’s direction. Whether you are a day trader hunting for quick entries or a swing trader looking for reliable trend confirmation, incorporating the HMA into your technical toolkit can help you stay ahead of the curve. Just remember to use it alongside other indicators and robust risk management strategies to navigate volatile markets effectively.
By mastering the HMA, you not only enhance your technical analysis but also improve your overall trading discipline—a critical edge in today’s fast-moving financial markets.
Disclaimer: This article is for educational purposes only and does not constitute financial advice. Please consult a certified financial advisor before making any investment decisions.
Written by Suchitra
11th Mar 2025 / 8 Mins Read
Featured Posts

By Asma Torgal
8th July 2024
Stock Market Sentiment Drives Trading Decisions

By Tejaswi P
30th Aug 2024
Can Government Employees Do Trading in the Stock Market?
_11zon.webp?alt=media&token=bd974821-aee4-43a5-b467-01d1a67a570b)
By Suchitra
29th Mar 2025
Algo Trading in India Tech-Driven Strategies for Modern Investors
_20_11zon.webp?alt=media&token=6659b2e6-927e-42de-8375-e227e579f556)
By Asma Torgal
28th Mar 2025
Trading Across Time Zones, The Global Market Timings in IST
By
Fri Mar 21 2025
How to Use Parallel Channels, Trends & Patterns
_11zon.webp?alt=media&token=a8f3f55c-dc70-4d42-844e-6874ceff69ce)
By Suchitra
20th Mar 2025
Swing and Positional Trading with Pivot Points
_11zon.webp?alt=media&token=a05d2324-cace-44ed-a35f-50f9e63be9c3)
By Suchitra
13th Mar 2025
How Central Banks Influence Indian Stock Market Trends
_11zon.webp?alt=media&token=14cd8f87-8add-49ce-84f1-ca07a0c52b0c)
By Suchitra
12th Mar 2025
Two Essential Candlestick Patterns for Market Timing

By Suchitra
05th Mar 2025
How Algorithmic trading revolutionizes modern markets with efficiency and speed

By Asma Torgal
24th Sep 2024
Lot Size in Futures & Options Trading