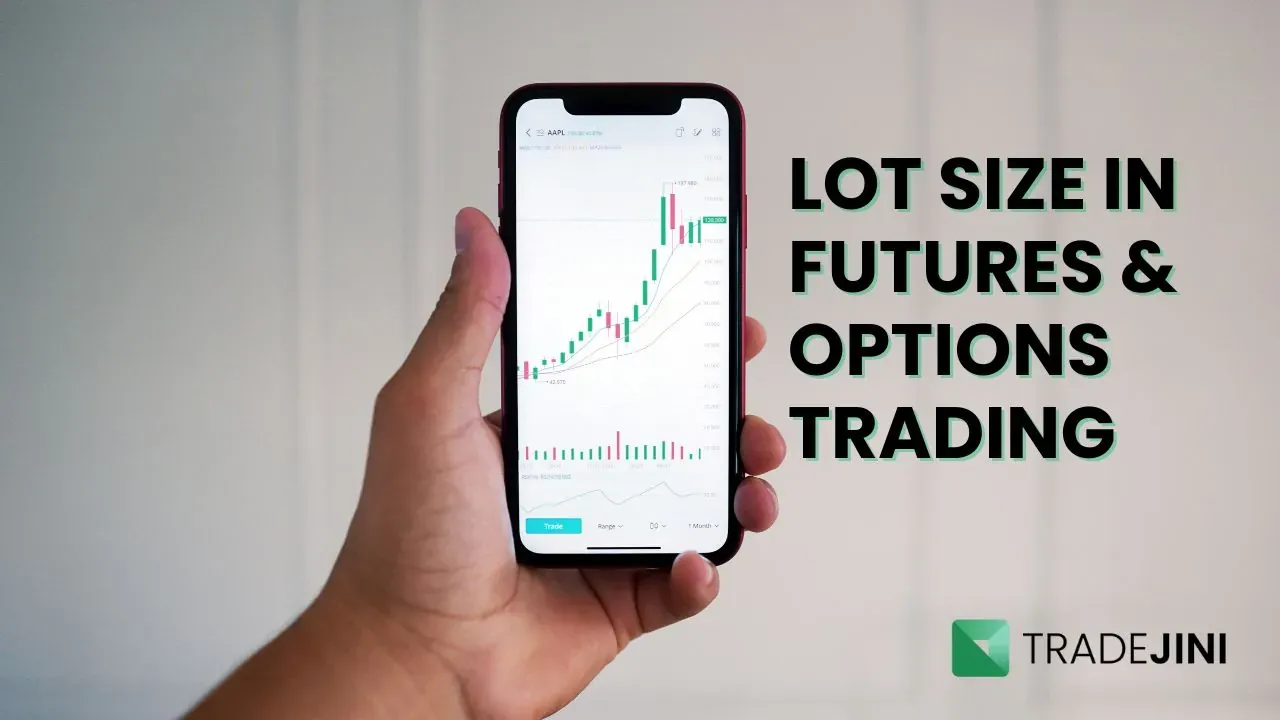
Technical Analysis in F&O
Basics of Futures and Options Trading
Let's simplify Futures and Options with easy examples.
Futures: Imagine you're buying a car. You agree to buy it at a fixed price in three months. No matter if the car's market price goes up or down, you'll pay the price you agreed on. This is like a futures contract. It's a deal to buy or sell something at a fixed price in the future. Traders use futures to fix their costs or to bet on how prices will change.
Options: Imagine buying a movie ticket in advance for a blockbuster coming out next month. You can choose to buy the ticket at the original price later, or not buy it at all. This is like an option. It gives you the right to buy (call option) or sell (put option) something at a certain price in the future, but you don't have to if you don't want to.

Knowing these tools is important because they're the foundation for using technical analysis in F&O trading.
Leverage and Its Role in F&O
Both Futures and Options are leveraged instruments. This means you can control a big amount of assets with a small amount of money. It's like having a stronger effect with less effort. Leverage increases both potential profits and losses, so knowing and managing risks is important.
Pillars of Technical Analysis
Technical analysis is a method which is used to evaluate and forecast future price trends in the market, mainly by analyzing charts. It rests on three main principles:
- Market Action Discounts Everything: This key idea suggests that all available information is already factored into prices. Essentially, the current price reflects the collective knowledge and expectations of all market participants.
- Prices Move in Trends: At the heart of technical analysis is the belief that prices follow specific patterns and trends. Identifying these trends early is crucial for successful trading.
- History Tends to Repeat Itself: Market behavior is consistently influenced by market psychology. As a result, certain patterns and trends reappear over time.

Chart Types and Their Interpretation
- Line Charts: The most basic form, these charts connect closing prices with a line. They offer a straightforward view of the trend over a period.
- Bar Charts: These charts show more details (open, high, low, and close prices). Each bar represents a trading period and provides insight into market sentiment.
- Candlestick Charts: With origins in Japan, these charts are akin to bar charts but use colors to show if the closing price was higher or lower than the opening price. They are especially valued for vividly representing market psychology and sentiment.
Example: A candlestick with a long lower shadow and a short body, known as a 'hammer', indicates that despite strong selling pressure, buyers were able to push the price back up near the opening level, hinting at a potential bullish reversal.
Trend Analysis
- Uptrends: These are identified by a series of higher highs and higher lows. In such scenarios, traders often look for buying opportunities.
- Downtrends: Characterized by lower highs and lower lows, downtrends suggest possible short-selling opportunities or signals to exit long positions.
Example: A stock consistently achieving higher peaks and troughs over a period exemplifies an uptrend, reflecting bullish sentiment among traders.

Support and Resistance
- Support: This refers to a price level where a falling trend is likely to pause due to concentrated demand. It acts like a floor, causing the price to bounce back up.
- Resistance: The opposite of support, resistance is a level where price stops rising and might reverse due to selling pressure.
Example: If a stock repeatedly struggles to exceed Rs 100, that price serves as a resistance level. Conversely, if it seldom drops below Rs 80, this is its support level.
In summary, technical analysis in F&O trading relies heavily on understanding these principles and interpreting various chart types to identify market trends, support and resistance levels, guiding traders in making informed decisions.
Technical Indicators and Tools
Technical indicators are vital tools for traders, providing insights into market trends and aiding in the prediction of future price movements. Let's delve deeper into some of the most commonly used indicators in technical analysis.
Moving Averages (MAs)
- Simple Moving Average (SMA): This indicator calculates the average price of a security over a specified number of days. By doing so, it helps smooth out price fluctuations and provides a clearer view of the overall trend direction.
Example: A 50-day SMA is calculated by taking the average closing price of a security over the past 50 days. This average helps identify whether the general trend over this period is upwards or downwards.
- Exponential Moving Average (EMA): Similar to the SMA, the EMA also calculates an average price over a certain period. However, it gives more weight to recent prices, thus making it more responsive to new market information. This feature makes the EMA particularly useful for traders looking to respond quickly to recent price changes.

Example: A 20-day EMA will be more sensitive to price movements than a 20-day SMA. For traders focusing on short-term strategies, this sensitivity can provide early signals of trend changes.
Momentum Indicators
- Relative Strength Index (RSI): This tool measures the magnitude of recent price changes to evaluate if a security is in overbought or oversold conditions. The RSI is scaled from 0 to 100, providing a quantifiable measure of market conditions.
Example: An RSI reading above 70 is typically considered to indicate that a security is overbought, suggesting a potential price pullback. Conversely, an RSI below 30 often signals oversold conditions, indicating a possible price increase.
- Moving Average Convergence Divergence (MACD): The MACD compares two EMAs of a security to determine the momentum. The main MACD line is the difference between the 26-day and 12-day EMAs, and a signal line (the 9-day EMA of the MACD) is plotted alongside to identify potential buy or sell signals.
Example: When the MACD line crosses above the signal line, it's considered a bullish signal, indicating a potential upward price movement. A crossover below the signal line is seen as bearish, hinting at a potential downward trend.
Risk Management
Effective risk management is key in F&O trading to protect against significant losses.
- Stop-Loss Orders: These are pre-set orders to sell a security when it reaches a certain price, effectively capping the potential loss on a position.
Example: A trader might set a stop-loss order at a price slightly below the purchase price or a key support level to automatically exit the position and limit losses if the market moves unfavorably.
- Position Sizing: This involves adjusting the size of a trading position based on the level of risk associated with the trade. It's crucial for managing the overall risk exposure of a portfolio.
Example: A trader might invest only a small percentage of their total capital in a high-risk trade, while allocating more capital to trades with lower perceived risk.
In summary, applying technical analysis in F&O trading requires a blend of strategic planning, understanding of market indicators and patterns, and diligent risk management. These strategies enable traders to make more informed decisions, capitalize on market movements, and protect their investments from undue risk.

_11zon.webp?alt=media&token=bd974821-aee4-43a5-b467-01d1a67a570b)
_20_11zon.webp?alt=media&token=6659b2e6-927e-42de-8375-e227e579f556)
_11zon.webp?alt=media&token=a8f3f55c-dc70-4d42-844e-6874ceff69ce)
_11zon.webp?alt=media&token=a05d2324-cace-44ed-a35f-50f9e63be9c3)
_11zon.webp?alt=media&token=14cd8f87-8add-49ce-84f1-ca07a0c52b0c)


