Read Between the Lines with Hollow Candlesticks
Traders are always looking for that one edge: a clearer signal, a better chart, or a more reliable pattern. While traditional candlestick charts have long been the go-to for technical analysis, there's a lesser-known cousin that's quietly gaining popularity: the hollow candlestick chart.
At first glance, it may look similar to the classic candlestick, but with a slight twist in design and logic, it tells a deeper story about momentum and trend conviction. If you’ve ever struggled to spot false breakouts or second-guessed a trend reversal, hollow candlesticks might just offer the clarity you’ve been missing.
In this article, we’ll break down how they work, why they matter, and how they can help sharpen your trading decisions without reinventing your entire strategy.
What are hollow candlesticks?
Hollow candlestick charts function similarly to traditional candlestick charts but differ in how they represent price movements. Here's how to read hollow candlestick charts. For a candle to be classified as hollow, the following criteria need to be met:
-
Hollow Green Candle: Indicates that the closing price is higher than the opening price and also higher than the previous candle's closing price. This signals strong bullish momentum.
-
Filled Red Candle: Indicates that the closing price is lower than the opening price and lower than the previous candle's close. This signals strong bearish momentum.
By analyzing these two important patterns, traders can assess market trends more effectively and anticipate price movements with greater accuracy.
| Hollow Green Candle | Filled Red Candle |
 |  |
Traditional vs. hollow candlesticks
| Feature | Traditional Candlesticks | Hollow Candlesticks |
|---|---|---|
| Colour Coding | Compares close to open of the same day | Compares close to open and also previous day's candle |
| Interpretation | Standard bullish/bearish | Highlights momentum shifts |
| Best For | General market trends | Identifying trend strength |
Why use hollow candlesticks?
Hollow candlesticks provide deeper insights into market movements by clearly distinguishing between momentum-driven price increases and minor recoveries within a downtrend. This added clarity helps traders make informed decisions, especially in volatile markets.
Common Patterns and Interpretations in Hollow Candlesticks
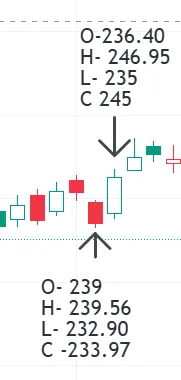
1. Bullish Engulfing Pattern
-
Traditional Interpretation: A small bearish candle is followed by a large bullish candle that engulfs the previous candle, indicating a potential reversal from a downtrend to an uptrend.
-
Hollow Candlestick Interpretation: If the second candle is a hollow green candle, it reinforces the bullish sentiment by showing that the closing price is higher than both the opening and the previous close.
(Hollow candlestick image)
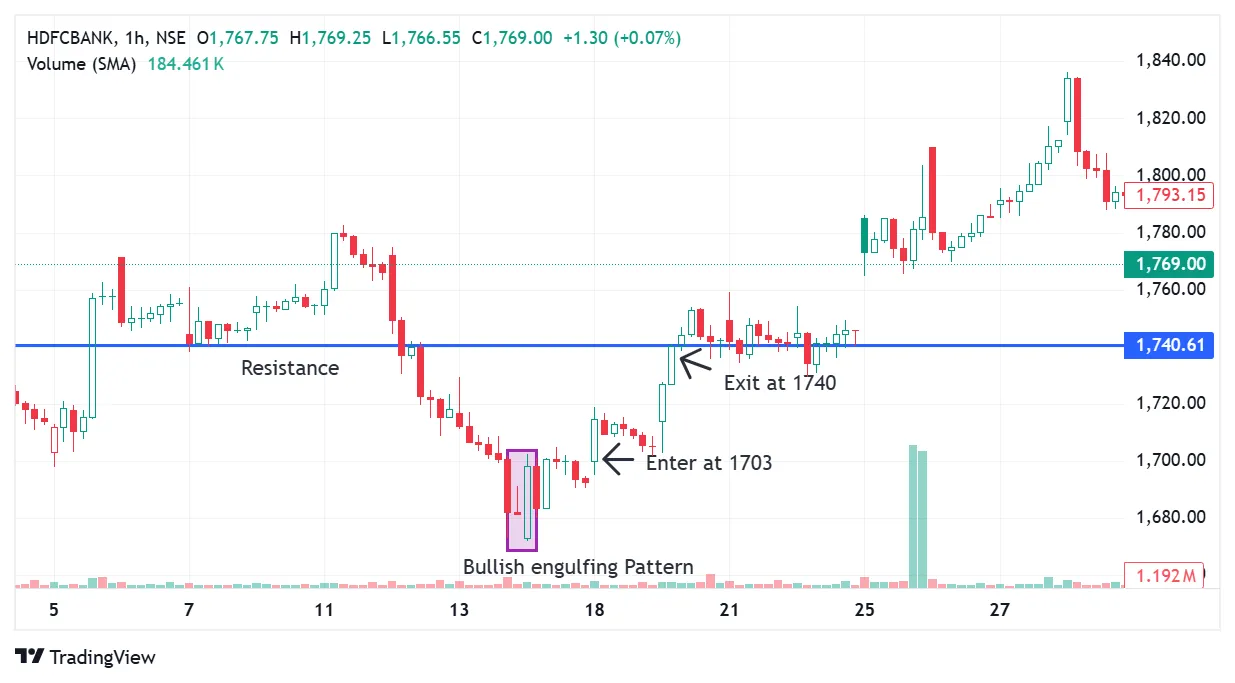
On 14th November 2024, HDFC Bank's stock formed a Bullish Engulfing pattern, indicating a potential trend reversal. However, the MACD crossover occurred on 18th November 2024, confirming the bullish momentum.
Entry confirmation:
-
The confirmation of entry came when the stock broke the high of the Bullish Engulfing pattern on 18th November 2024.
-
At the same time, the MACD crossover further validated the bullish trend.
-
A strong entry signal was confirmed at 1,703.
Exit strategy:
-
The next resistance level was identified at 1,740.
-
As the stock approached this level, it signalled an ideal exit point, securing a gain of 37 points.
Stop-loss placement:
- The stop-loss was placed below the bullish engulfing pattern at 1,673, ensuring risk management.
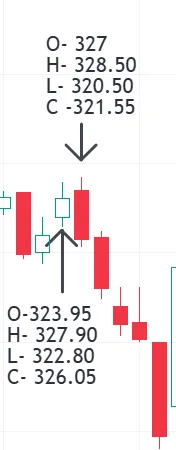
2. Bearish engulfing pattern
-
Traditional interpretation: A small bullish candle is followed by a large bearish candle that engulfs the previous candle, suggesting a reversal from an uptrend to a downtrend.
-
Hollow candlestick interpretation: If the second candle is a filled red candle, it strengthens the bearish signal by indicating that the closing price is lower than both the opening and the previous close.
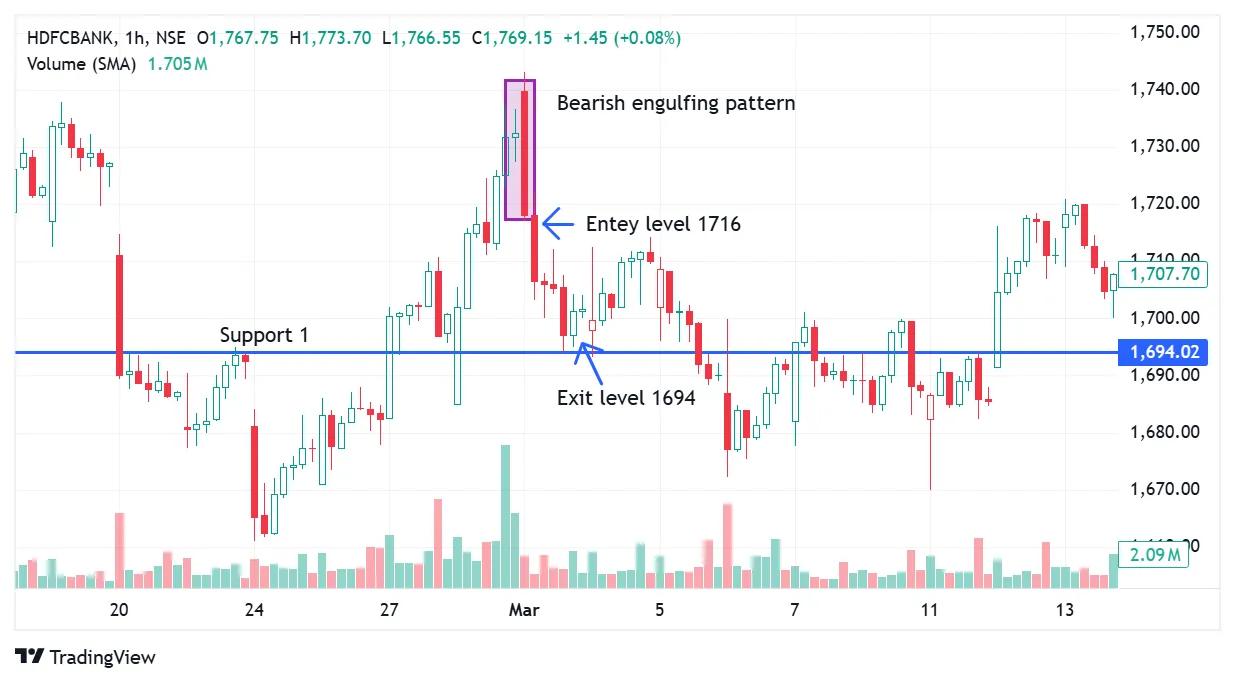
On 3rd March 2025, HDFC Bank's stock formed a bearish engulfing pattern, signalling a potential downtrend. At the same time, a MACD crossover occurred, confirming the bearish momentum.
Entry confirmation:
-
The confirmation for a sell entry came as the MACD crossover aligned with the bearish engulfing pattern.
-
A strong entry signal was triggered at 1,716.
Exit strategy:
-
The next support level was identified at 1,694.
-
As the stock approached this level, it signalled an ideal exit point, securing a gain of 22 points.
Stop-loss placement:
- The stop-loss was placed above the bearish engulfing pattern at 1,740, ensuring proper risk management.
3. Three white soldiers
-
Traditional interpretation: Three consecutive long bullish candles with higher closes, indicating a strong uptrend.
-
Hollow candlestick interpretation: If all three candles are hollow green, it reinforces the bullish trend by showing consistently higher closes compared to previous periods.
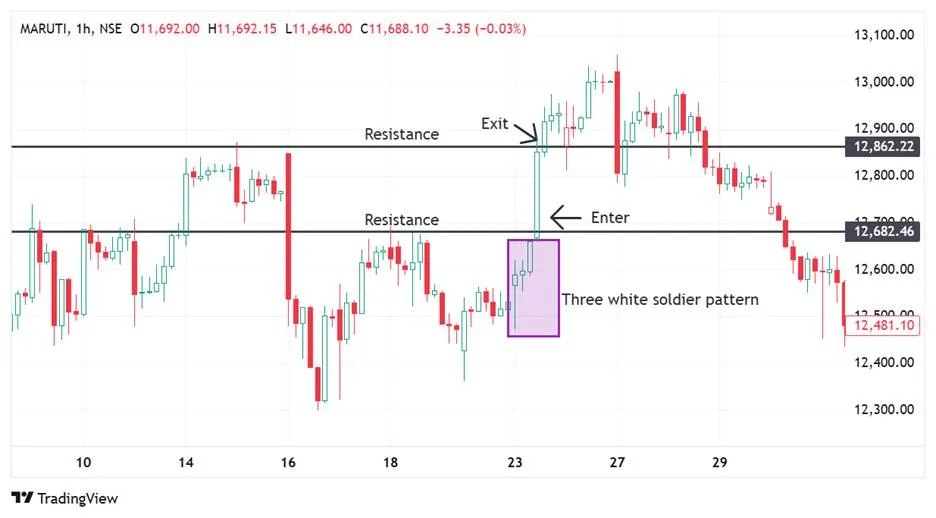
On 23rd May 2024, Maruti's stock formed a Three White Soldiers pattern, indicating a strong bullish reversal.
Entry confirmation:
-
The confirmation of entry came when the stock broke the resistance level of 12,677.
-
Additionally, the candlestick pattern appeared above the 50-day EMA (Exponential Moving Average), further validating the bullish momentum.
-
A strong entry signal was confirmed at 12,690.
Exit strategy:
-
The next resistance level was identified at 12,862.
-
As the stock approached this level, it signalled an ideal exit point, securing a gain of approximately 170 points.
How to interpret hollow candlestick charts
- Identify trend strength: Consecutive hollow candles indicate a strong uptrend, while multiple filled candles signal a bearish shift.
- Confirm momentum shifts: A transition from filled to hollow candlesticks suggests increasing buyer interest.
- Combine with other indicators: Use moving averages, MACD or volume analysis to validate signals from hollow candlesticks.
Case study: Reliance Infra Chart Comparison—Hollow vs traditional candlesticks (April 3, 2025, Daily Time Frame)
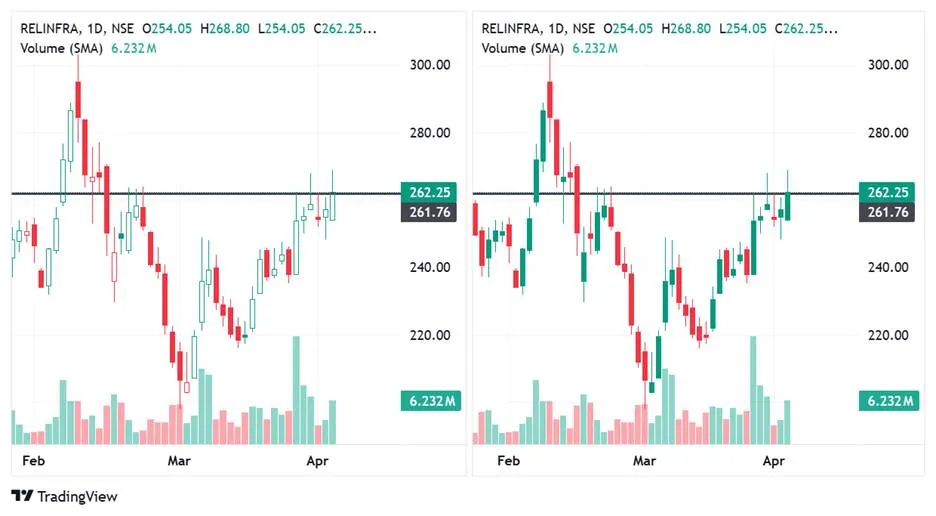
For the provided chart of RELINFRA (1D, NSE), here's how hollow candlesticks could provide a clearer picture of trend direction and entry points:
Clearer trend identification
-
In a traditional candlestick chart (as seen in the images), green and red candles can sometimes be misleading. A green candle does not always indicate strong buying, and a red candle does not always indicate strong selling.
-
If you were using hollow candlesticks, the trend would be easier to read.
-
- Green Hollow candles (Close > Open) indicate strong bullish momentum, making it easier to spot uptrends.
-
- Red-filled candles (Close < Open) indicate strong bearish pressure, making it clearer when sellers are in control.
What is chart telling:
-
Look at the April breakout above ₹263. With hollow candlesticks, you could see if these candles were hollow (strong buyers) or filled (possible weakness).
-
If hollow, it could confirm a strong entry signal for a continuation of the trend.
Embrace hollow candlesticks for smarter trading
Hollow candlestick charts provide a clear visual representation of market sentiment by distinguishing between bullish and bearish movements more effectively than traditional candlestick charts. The hollow and filled structure helps traders quickly identify price trends, momentum shifts, and potential reversals.
By integrating hollow candlestick analysis with other technical indicators like volume, moving averages, and trendlines, traders can make more informed trading decisions. However, as with any technical tool, it is crucial to combine it with risk management strategies to minimize potential losses.
Disclaimer: This article is for educational purposes only and does not constitute financial advice. Please consult a certified financial advisor before making any investment decisions.
Written by Suchitra
15th Apr 2025 / 6 Mins Read
Featured Posts

By Asma Torgal
8th July 2024
Stock Market Sentiment Drives Trading Decisions

By Tejaswi P
30th Aug 2024
Can Government Employees Do Trading in the Stock Market?
_11zon.webp?alt=media&token=bd974821-aee4-43a5-b467-01d1a67a570b)
By Suchitra
29th Mar 2025
Algo Trading in India Tech-Driven Strategies for Modern Investors
_20_11zon.webp?alt=media&token=6659b2e6-927e-42de-8375-e227e579f556)
By Asma Torgal
28th Mar 2025
Trading Across Time Zones, The Global Market Timings in IST
By
Fri Mar 21 2025
How to Use Parallel Channels, Trends & Patterns
_11zon.webp?alt=media&token=a8f3f55c-dc70-4d42-844e-6874ceff69ce)
By Suchitra
20th Mar 2025
Swing and Positional Trading with Pivot Points
_11zon.webp?alt=media&token=a05d2324-cace-44ed-a35f-50f9e63be9c3)
By Suchitra
13th Mar 2025
How Central Banks Influence Indian Stock Market Trends
_11zon.webp?alt=media&token=14cd8f87-8add-49ce-84f1-ca07a0c52b0c)
By Suchitra
12th Mar 2025
Two Essential Candlestick Patterns for Market Timing

By Suchitra
05th Mar 2025
How Algorithmic trading revolutionizes modern markets with efficiency and speed
By Asma Torgal
24th Sep 2024
Lot Size in Futures & Options Trading