Using Pivot Points For Support and Resistance
Pivot points are key price levels traders use to identify potential market reversals. Calculated using the previous day's high, low, and close, these levels help traders spot support and resistance zones. While not foolproof, pivot points provide a structured approach to day trading and short-term strategies. Understanding their limitations and combining them with other indicators can enhance trading decisions.
Pivot points are specific price levels that tend to act as turning points in the market—nothing fancy or complicated about it. Back in the day, floor traders would calculate these levels by hand (yes, really!) before the trading day even started, using them as quick clues about where the market might reverse. Today, trading platforms do the math automatically, but the core idea remains the same—in other words, these are simply price levels where the market often reacts.
The Simple Math Behind Pivot Points
Pivot points are unique because they are calculated from actual market prices, not by complex formulas. They are derived from three key numbers from the previous day’s trading: high, low, and close.
- High: The highest price of the day.
- Low: The lowest price of the day.
- Close: The final price at the end of the day.
How to Calculate Pivot Points?
This is classic method. Below are the steps:
- Pivot Point (P): P = (High + Low + Close) ÷ 3 This central level helps analyze price movements.
- First Resistance (R1) and First Support (S1): R1 = (2 × P) - Low S1 = (2 × P) - High These levels indicate where prices might face resistance or find support.
- Second Resistance (R2) and Second Support (S2): R2 = P + (High - Low) S2 = P - (High - Low) These levels represent stronger potential barriers or floors.
Example, Let’s use the following hypothetical data:
- Previous day’s high: 150
- Previous day’s low: 140
- S1Previous day’s close: 142
Step 1: Calculate the pivot point (P):
P = (150 + 140 + 142) ÷ 3 = 432 ÷ 3 = 144
Step 2: Calculate the first resistance (R1) and first support (S1):
R1 = (2 × 144) - 140 = 288 - 140 = 148 = (2 × 144) - 150 = 288 - 150 = 138
Step 3: Calculate the second resistance (R2) and second support (S2):
R2 = 144 + (150 - 140) = 144 + 10 = 154
S2 = 144 - 10 = 134
Result: Pivot Point: 144
Resistances: R1 = 148, R2 = 154
Supports: S1 = 138, S2 = 134
These levels help traders anticipate possible price movements and reactions.
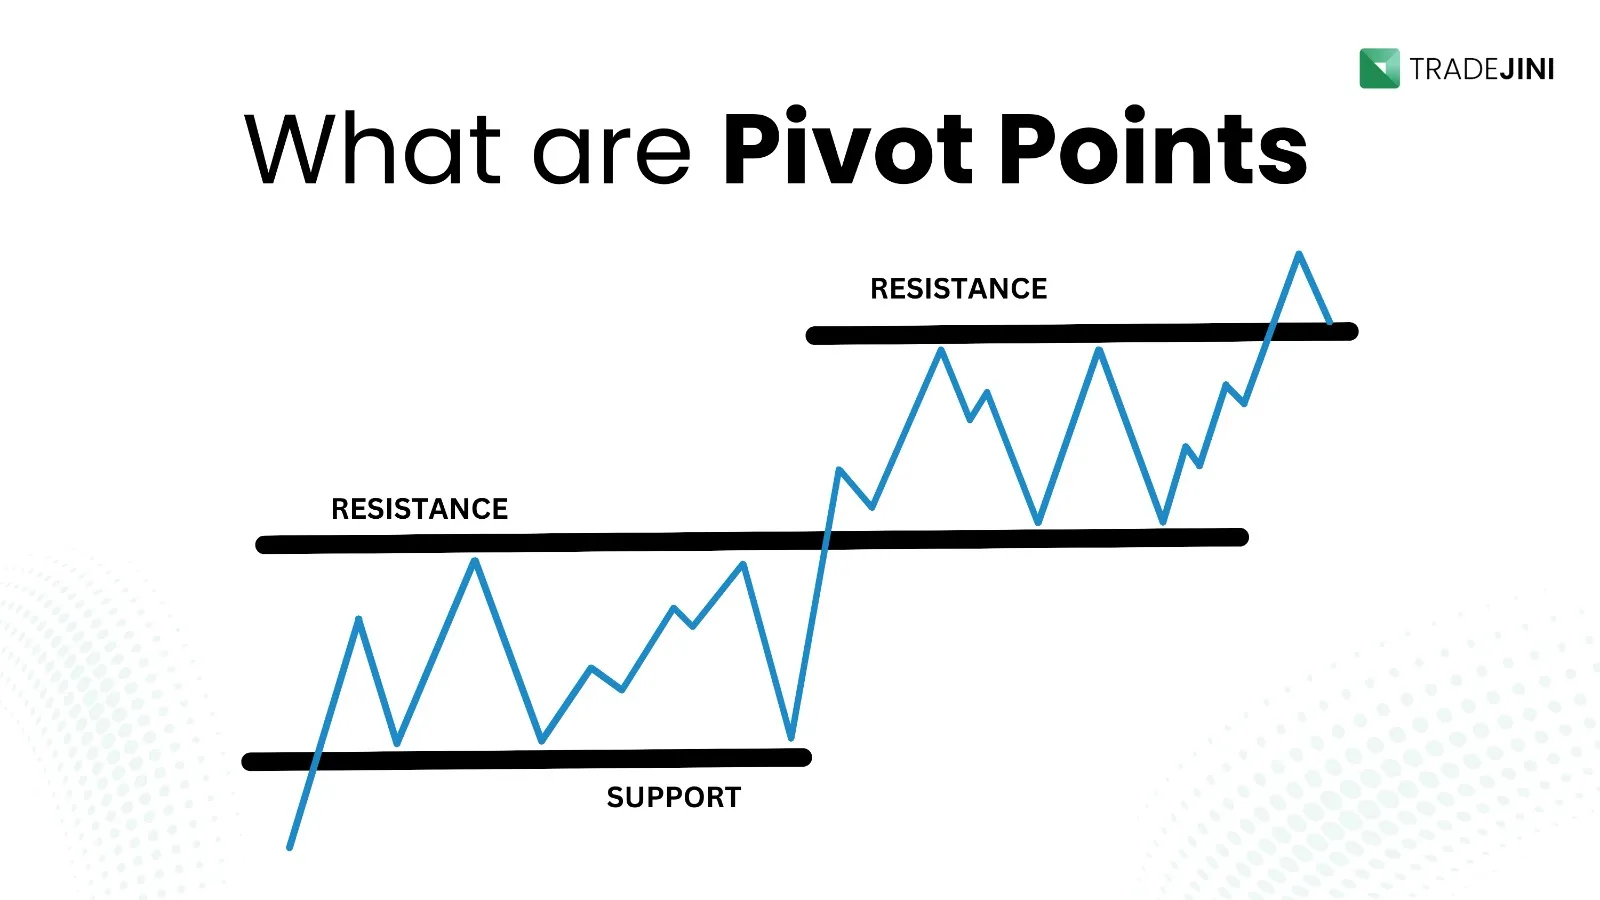
Understanding Support and Resistance
Think of support and resistance like the floor and ceiling in a room—support is where falling prices tend to stop, while resistance is where rising prices are held back. Most traders keep an eye on just a few key levels:
-
Main Pivot Point: Acts like a central line.
-
First Support and Resistance: The primary levels where the price is likely to react.
-
Second Support and Resistance: These serve as backup levels.
In other words, support is where buyers typically step in (imagine a floor that stops a fall), and resistance is where sellers enter (like a ceiling that stops a rise). With multiple layers provided by pivot points, traders get a clearer picture of potential reversals.
Why Do Traders Use Pivot Points?
Traders rely on pivot points for several good reasons:
-
Identifying Key Price Levels: They provide predefined support and resistance levels, making it easier to plan trades.
-
Spotting Potential Reversals: When prices approach these levels, there’s a good chance of a reversal—helping traders decide when to enter or exit positions.
-
Day Trading and Short-Term Strategies: Pivot points are especially popular with day traders who need clear price markers throughout the day.
-
Simplifying Decision-Making: Rather than reacting to every little market move, pivot points offer a straightforward guide to help make more calculated trading decisions.
Making Pivot Points Work in Real Trading
Here’s the thing—pivot points are just guidelines, not magic lines. The market doesn’t always respect them as not all days are winning days, but when it does, they can be incredibly useful. Some days, prices will bounce right off these levels; other days, they might break through without a fuss. The key is to watch how prices react when they hit these markers.
Starting Out with Pivot Points
If you’re new to using pivot points, start simple:
-
First Week: Plot just the main pivot point on your chart. Observe what happens when prices cross it and note if the market behaves differently at various times.
-
Second Week: Add the first support and resistance levels. Look for patterns and start jotting down your observations.
No need to rush—the market isn’t going anywhere, and getting comfortable with these concepts takes time.
Common Mistakes to Avoid
Treating levels of pivots as fixed prices instead of being only indicative.
Making trades solely when the price touches a pivot speculated level.
Overloading the chart with too many pivot points.
Ignoring other key market factors.
Conclusion
The first touch is not bound but is a productive manner of accessing a market when deciding when to change. In some cases, the leveled-out areas function as promised for some; loops may put whatsoever work in jeopardy; this is trading. However, knowing what pivot points can do while understanding their limitations is indeed the core formula for being able to use them. Keep it basic and little and notice how they fit your style of trading, while entering the market. As experience begins to affix itself unto you in no time, the fundamental guidelines enhance not only your decision-making abilities from any cluttering sort of wisdom but also open at least a hint for more advanced things. Therefore, get ready to try it out! Pick your favorite market and apply a diluted pivot to your chart data, then wait and observe its unfolding throughout the week; you may realize something out of the usual.
Disclaimer: This article is for educational purposes only and does not constitute financial advice. Please consult a certified financial advisor before making any investment decisions.
Written by Suchitra
22 Feb 2025 / 5 Mins Read
Featured Posts

By Asma Torgal
8th July 2024
Stock Market Sentiment Drives Trading Decisions

By Tejaswi P
30th Aug 2024
Can Government Employees Do Trading in the Stock Market?
_11zon.webp?alt=media&token=bd974821-aee4-43a5-b467-01d1a67a570b)
By Suchitra
29th Mar 2025
Algo Trading in India Tech-Driven Strategies for Modern Investors
_20_11zon.webp?alt=media&token=6659b2e6-927e-42de-8375-e227e579f556)
By Asma Torgal
28th Mar 2025
Trading Across Time Zones, The Global Market Timings in IST
By
Fri Mar 21 2025
How to Use Parallel Channels, Trends & Patterns
_11zon.webp?alt=media&token=a8f3f55c-dc70-4d42-844e-6874ceff69ce)
By Suchitra
20th Mar 2025
Swing and Positional Trading with Pivot Points
_11zon.webp?alt=media&token=a05d2324-cace-44ed-a35f-50f9e63be9c3)
By Suchitra
13th Mar 2025
How Central Banks Influence Indian Stock Market Trends
_11zon.webp?alt=media&token=14cd8f87-8add-49ce-84f1-ca07a0c52b0c)
By Suchitra
12th Mar 2025
Two Essential Candlestick Patterns for Market Timing

By Suchitra
05th Mar 2025
How Algorithmic trading revolutionizes modern markets with efficiency and speed
By Asma Torgal
24th Sep 2024
Lot Size in Futures & Options Trading