Combining Candlestick Patterns with Technical Indicators
_7_11zon.webp?alt=media&token=05a5c15e-8b09-4a0d-8693-d5df49cfeaa8)
Trading effectively requires more than just recognizing candlestick patterns. By integrating technical indicators like RSI, MACD, and trendlines, traders can validate signals, reduce false trades, and improve decision-making. This article explores key combinations such as Doji with RSI for trend reversals, Bullish Engulfing with MACD for momentum confirmation, and Hammer with trendline support for stronger entry signals. By stacking probabilities with multiple confirmations, traders can enhance their strategies and make more confident, well-informed trades.
Trading is all about making informed decisions, and relying on a single candlestick pattern may not always be enough. While candlestick patterns are powerful in spotting potential price movements, combining them with technical indicators adds an extra layer of confidence. It is like getting a second opinion before making a big decision wouldn’t that make you feel more assured? By integrating indicators like RSI, MACD, and trendlines, you can significantly enhance your trading accuracy, reduce false signals, and improve your overall success rate. By the end of this article, you will realize how magical this combination can be in your trading journey.
1. Doji and Spinning Top + RSI
Doji:
A Doji candlestick signals market indecision, with the opening and closing prices nearly equal. It reflects a balance between buyers and sellers, often hinting at potential trend reversals. In technical analysis, Dojis are crucial at key price levels, helping traders decide whether a trend will continue or shift direction.
Spinning Top:
A Spinning Top candlestick features small real bodies with longer upper and lower shadows, symbolizing indecision. It often indicates that neither buyers nor sellers dominated the session. When spotted after a strong trend, it can suggest a potential pause or reversal, making it a key signal in identifying changing market sentiment.
Confirm Overbought or Oversold Conditions
A Doji or Spinning Top signals indecision in the market. Once you spot either of these candlestick,check the RSI (Relative Strength Index). If RSI is at 70 or above, it indicates an overbought condition, and if it is at 30 or below, it signals an oversold condition. Additionally, if RSI shows divergence, it can further confirm a potential reversal, making it a good entry point for traders.
How to Use It:
- Spot a Doji or Spinning Top.
- Check RSI. If it is in the overbought or oversold zone, a reversal is likely.
- Wait for confirmation with the next candle before making a trade.
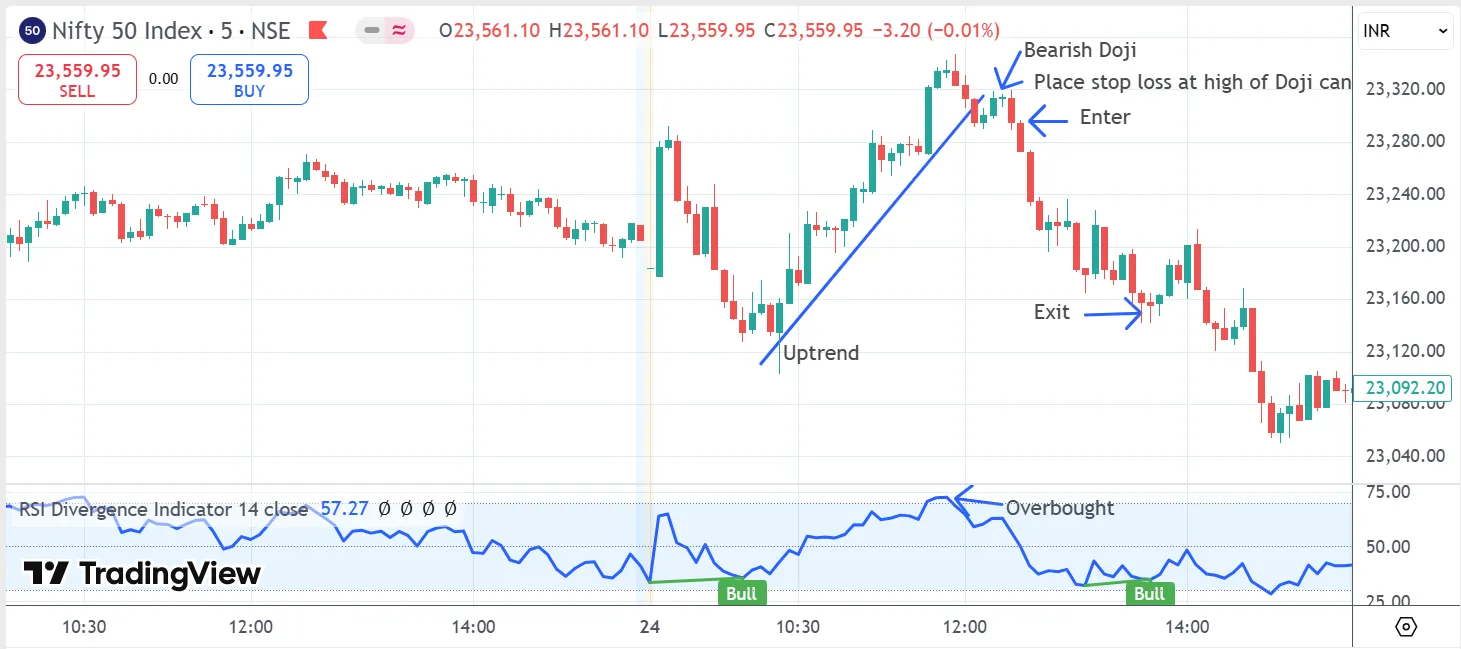
Doji + RSI– Confirm overbought or oversold conditions
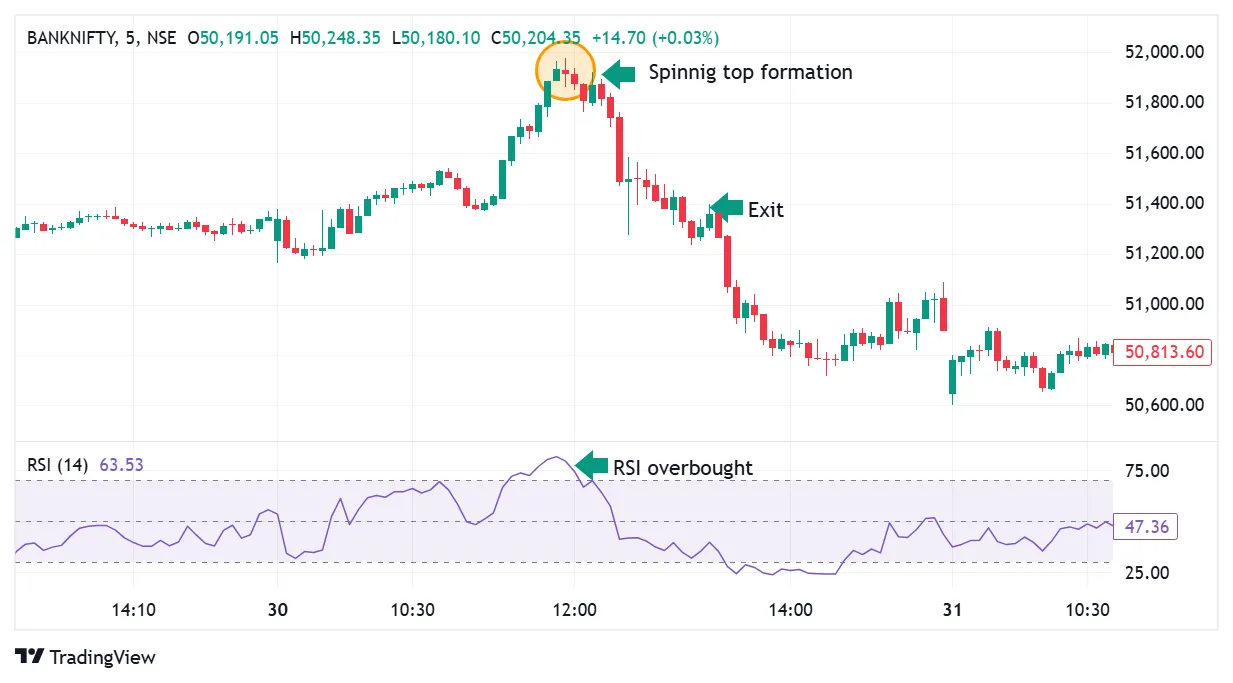
Spinning top +RSI
2. Bullish Engulfing + MACD Crossover
Bullish Engulfing:
A Bullish Engulfing candlestick forms when a larger green candle fully covers the previous red candle. It signals a potential trend reversal, indicating renewed buying interest and momentum, often seen at the end of a downtrend.
Timing Entries with Momentum
A Bullish Engulfing pattern signals strong buying pressure, but adding the MACD (Moving Average Convergence Divergence) crossover increases trade accuracy. A bullish crossover (MACD line crossing above the signal line) along with a Bullish Engulfing suggests that momentum is in favor of buyers, making it a high-probability trade.Vise-a-versa for bearish engulfing candlestick.
How to Use It:
-
Look for a Bullish Engulfing pattern.
-
Check if MACD is showing a bullish crossover.
-
Enter long when both conditions align for a stronger confirmation.
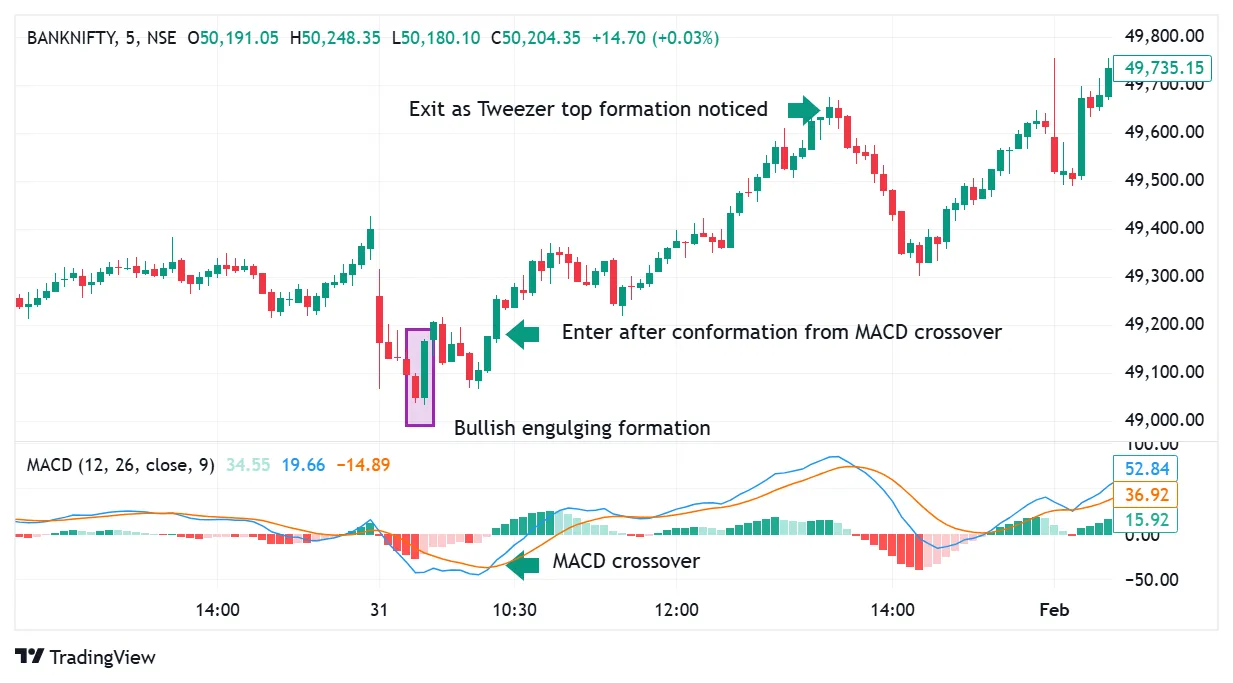
Bullish Engulfing + MACD Crossover
3. Hammer + Trendline Support
Hammer Candlestick:
A hammer candlestick appears after a downtrend, with a small body and a long lower wick, signaling potential reversal. It reflects strong buying pressure as prices recover from intraday lows, often hinting at a shift towards bullish momentum.
Stronger Reversal Confirmation
A Hammer at a support level already suggests a reversal, but when it aligns with a strong trendline support, the conviction is even stronger. This combination is a favorite among traders who wait for a clear sign of price rejection at a key level.
How to Use It:
-
Identify a Hammer candlestick.
-
Check if it is forming at a trendline support.
-
If the next candle confirms a reversal, enter a trade with confidence.
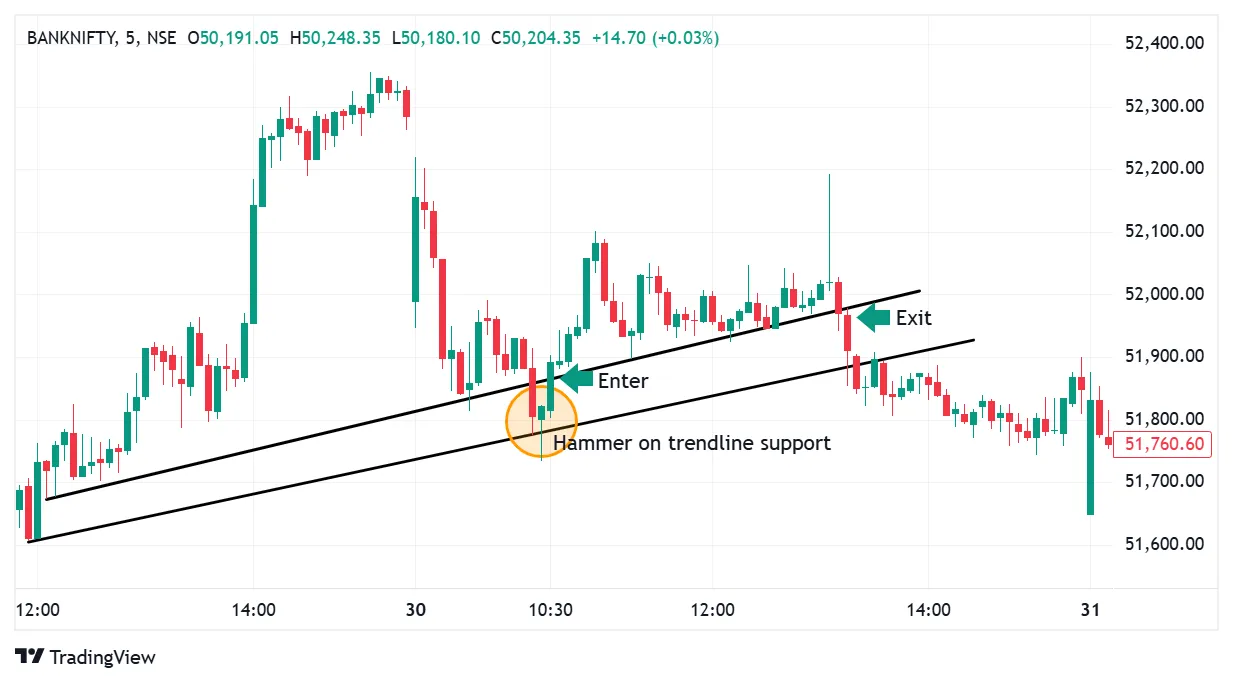
Hammer on trendline
4. Tweezer Bottom + RSI Divergence + MACD
Tweezer Bottom:
Tweezer Bottom candlesticks form at the end of a downtrend, with two candles having nearly identical lows. This pattern signals strong support and potential reversal as buyers step in, indicating a likely shift from bearish to bullish sentiment.
Identifying High-Probability Reversals
A Tweezer Bottom is a strong reversal pattern, but when paired with RSI divergence and MACD, it becomes a powerful setup. RSI divergence occurs when the price makes a new low, but RSI doesn’t indicating weakness in the downtrend. If MACD also shows a bullish crossover, the probability of a reversal skyrockets.
How to Use It:
-
Spot a Tweezer Bottom formation.
-
Check if RSI is showing bullish divergence (higher lows while price makes lower lows).
-
Confirm with a MACD bullish crossover.
-
Enter a long position for a high-probability trade.
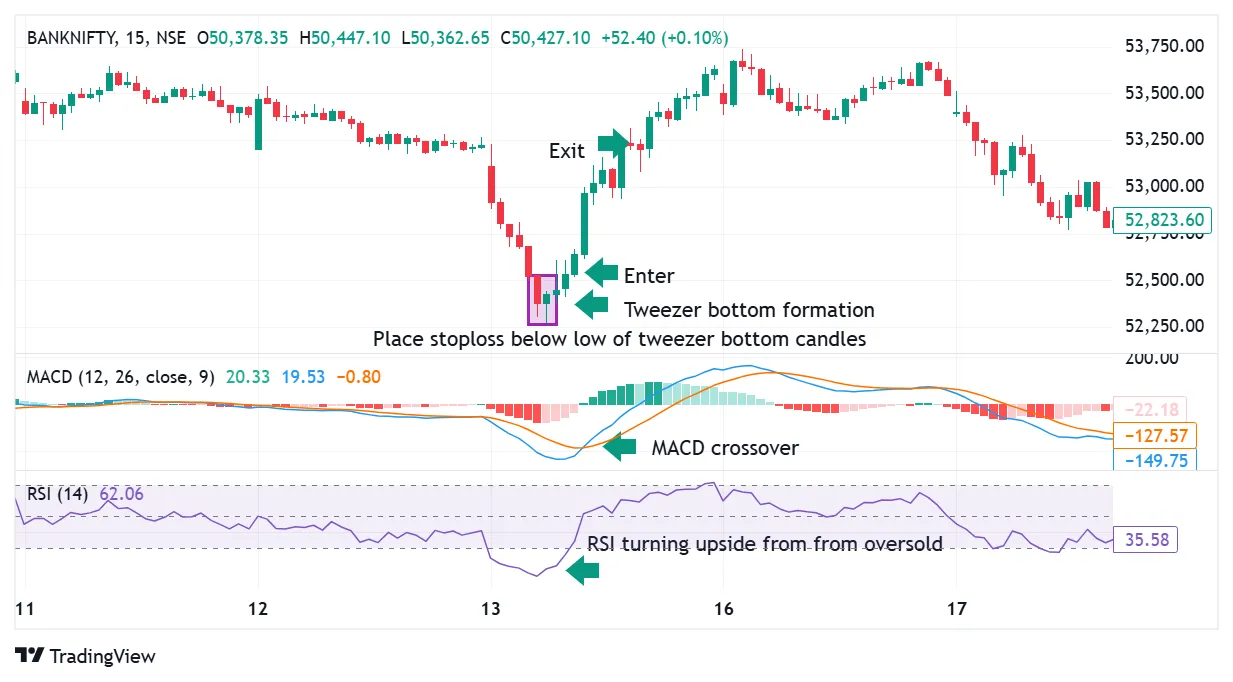
Tweezer Bottom + RSI Divergence+MACD
For a deeper understanding of individual candlestick patterns, visit the Tradejini website, where each pattern is explained in detail.
No indicator gives a guaranteed buy or sell signal. To trade effectively, you should follow proper discipline and focus on understanding price action and trends. Always use stop-loss orders to manage risk and ensure you have a clear risk-to-reward strategy. Consistency, patience, and learning market behavior are key to long-term trading success.
Conclusion
Trading isn’t just about spotting candlestick patterns it is about stacking probabilities in your favor. By integrating indicators with candlestick patterns, you gain extra confidence in your trades, reduce uncertainty, and make more informed decisions. The key is not to blindly follow patterns but to validate them with supporting indicators. Try these combinations in your trading strategy, and you’ll soon see the magic unfold in your trading journey.
Disclaimer: This article is for educational purposes only and does not constitute financial advice. Please consult a certified financial advisor before making any investment decisions.
Written by Suchitra
17th Mar 2025 / 5 Mins Read
Featured Posts

By Asma Torgal
8th July 2024
Stock Market Sentiment Drives Trading Decisions

By Tejaswi P
30th Aug 2024
Can Government Employees Do Trading in the Stock Market?
_11zon.webp?alt=media&token=bd974821-aee4-43a5-b467-01d1a67a570b)
By Suchitra
29th Mar 2025
Algo Trading in India Tech-Driven Strategies for Modern Investors
_20_11zon.webp?alt=media&token=6659b2e6-927e-42de-8375-e227e579f556)
By Asma Torgal
28th Mar 2025
Trading Across Time Zones, The Global Market Timings in IST
By
Fri Mar 21 2025
How to Use Parallel Channels, Trends & Patterns
_11zon.webp?alt=media&token=a8f3f55c-dc70-4d42-844e-6874ceff69ce)
By Suchitra
20th Mar 2025
Swing and Positional Trading with Pivot Points
_11zon.webp?alt=media&token=a05d2324-cace-44ed-a35f-50f9e63be9c3)
By Suchitra
13th Mar 2025
How Central Banks Influence Indian Stock Market Trends
_11zon.webp?alt=media&token=14cd8f87-8add-49ce-84f1-ca07a0c52b0c)
By Suchitra
12th Mar 2025
Two Essential Candlestick Patterns for Market Timing

By Suchitra
05th Mar 2025
How Algorithmic trading revolutionizes modern markets with efficiency and speed
By Asma Torgal
24th Sep 2024
Lot Size in Futures & Options Trading